I might be providing a solution which would have been solved umpteen times. But this solution is something I use and was born out of my own unique requirements.
Click here to view the Equity & Mutual Fund Investment Tracker
Who is this sheet for?
- Someone who is buying and not selling. Yes, no selling. In fact, I only track my buy transactions in this sheet. If you are a trader then this sheet is useless for you. You can skip reading the rest of the post. But if you are a long term investor—like me—then give this sheet a try.
- Someone who wants to see how their equity and mutual fund investments are performing vis-à-vis Nifty indices or competing mutual funds.
- Someone who wants to see how their equity investments are performing taking into consideration demergers that will happen along the way of their investment journey. Remember this is for long term investors.
Quick disclaimer. I have tested it only for Indian equities and mutual funds. Although I have kept it generic, it should work for other assets, but no guarantees.
Now coming to the Google Sheet itself.
It is divided into three tabs.
- Summary: This is where you will see details—Profit, XIRR, performance vis-à-vis Nifty index or mutual fund—of all your investments based on the data that you have entered in the Transactions tab.
- Transactions: This is where you will enter your transactions. Remember, only buy transactions. No sell transactions.
- Index Master: This is where you will list all the indices that you want to compare your investments against. This will end up showing in the Summary tab (column F). You will be updating this tab once in a while.
How to use this sheet?
It’s a two-step process.
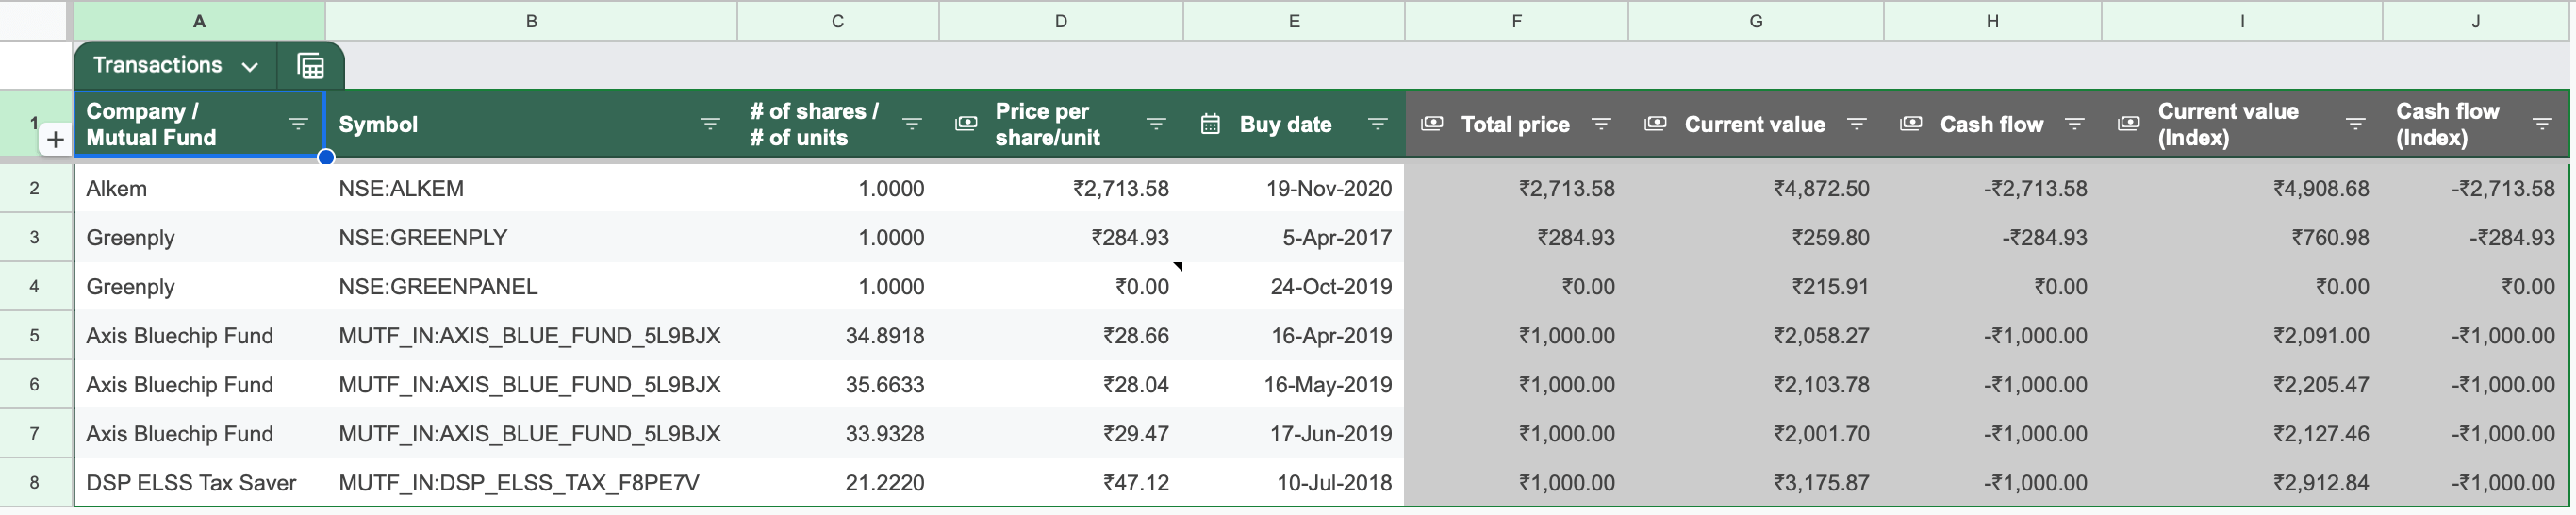
First, go to the Transactions tab (Figure 2) and enter the data in columns A to E. Columns F to J are all formulas and should not be modified.
In column B you will be entering the code of your equity or mutual fund that appears when you search for it on Google Finance. Some examples are given below.

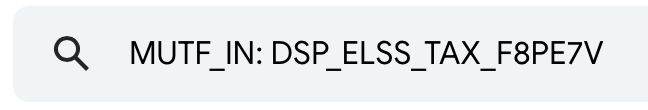
For symbol, there is a space that Google adds after the colon. Remove that space before adding it to the column B, else the formula will give error.
At times companies demerge some of their entities. Like Greenply did with Greenpanel and Grasim did with Aditya Birla Capital. To track these demerged entities, add the transaction of demerged entity with zero cost and the appropriate symbol name. You can see this in action in row 4 (Figure 2) where I added Greenpanel transaction with zero cost (column D) and Greenpanel symbol (column B). For the name (column A), keep it the same as Greenply since we received this share due to our investment in Greenply.
In the second step, you come to the Summary sheet. Here you add a new row and in the column A you mention the name of company of mutual fund matching the name you entered in the column A of Transactions tab. If the formula for the other columns doesn’t get auto updated, drag the formulas from the above row and select the Comparison Index (column F) to appropriate index. You can see this in action in Figure 1.
A couple of additional notes.
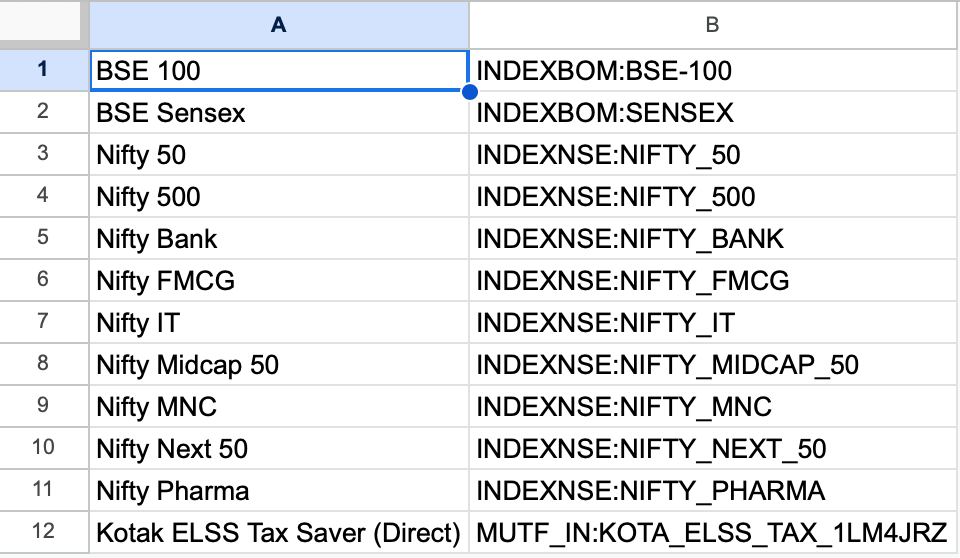
If you want additional indices or mutual funds to be compared you can add them in the Index Master sheet (Figure 5). The column B is the symbol name that appears on Google Finance. Just like we did in Figure 3 and 4. The column A is the name and you can enter the text that you want.
The mutual fund data that Google fetches is a bit stale. Maybe by 2-3 business days. Keep that in mind if you are looking at this sheet and making a sell decision.

You must be logged in to post a comment.