Back in 2019, I applied for Polycab’s IPO—more out of curiosity than conviction—and to my surprise, I landed an allotment. The stock listed at a 21% premium on day one. Not a bad start for what would become one of my most profitable investments.
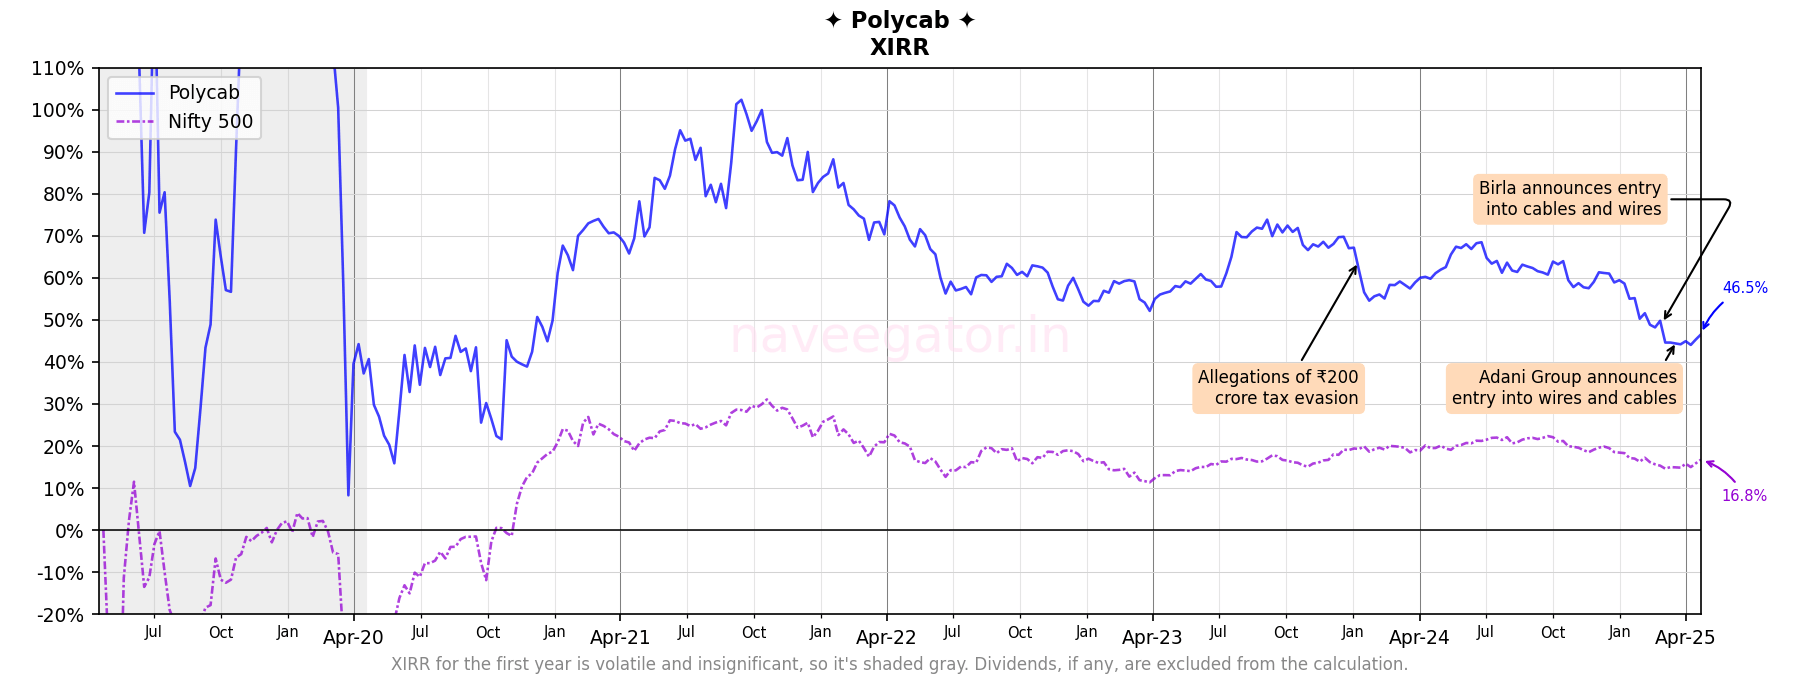
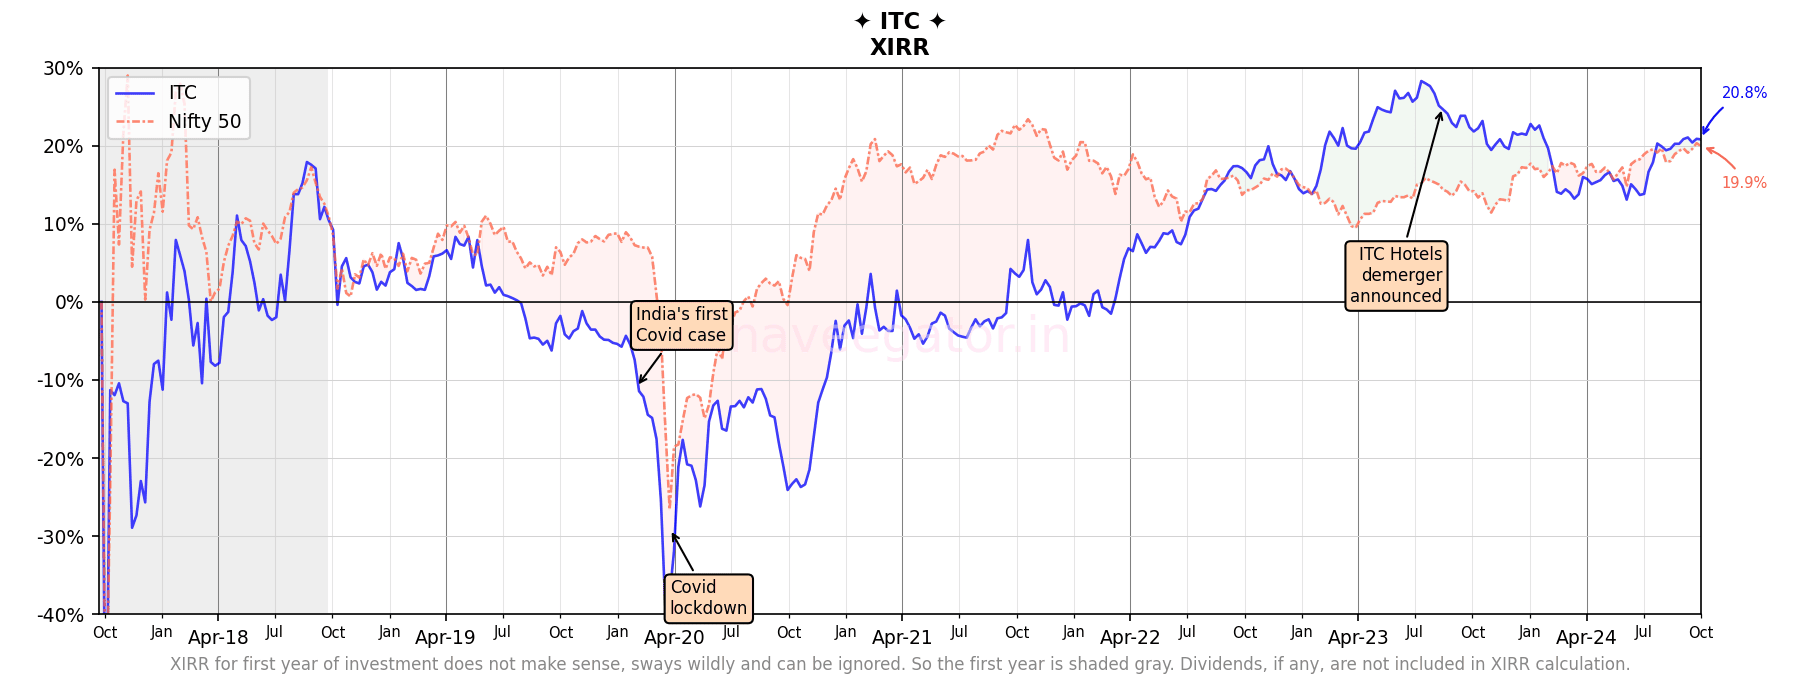
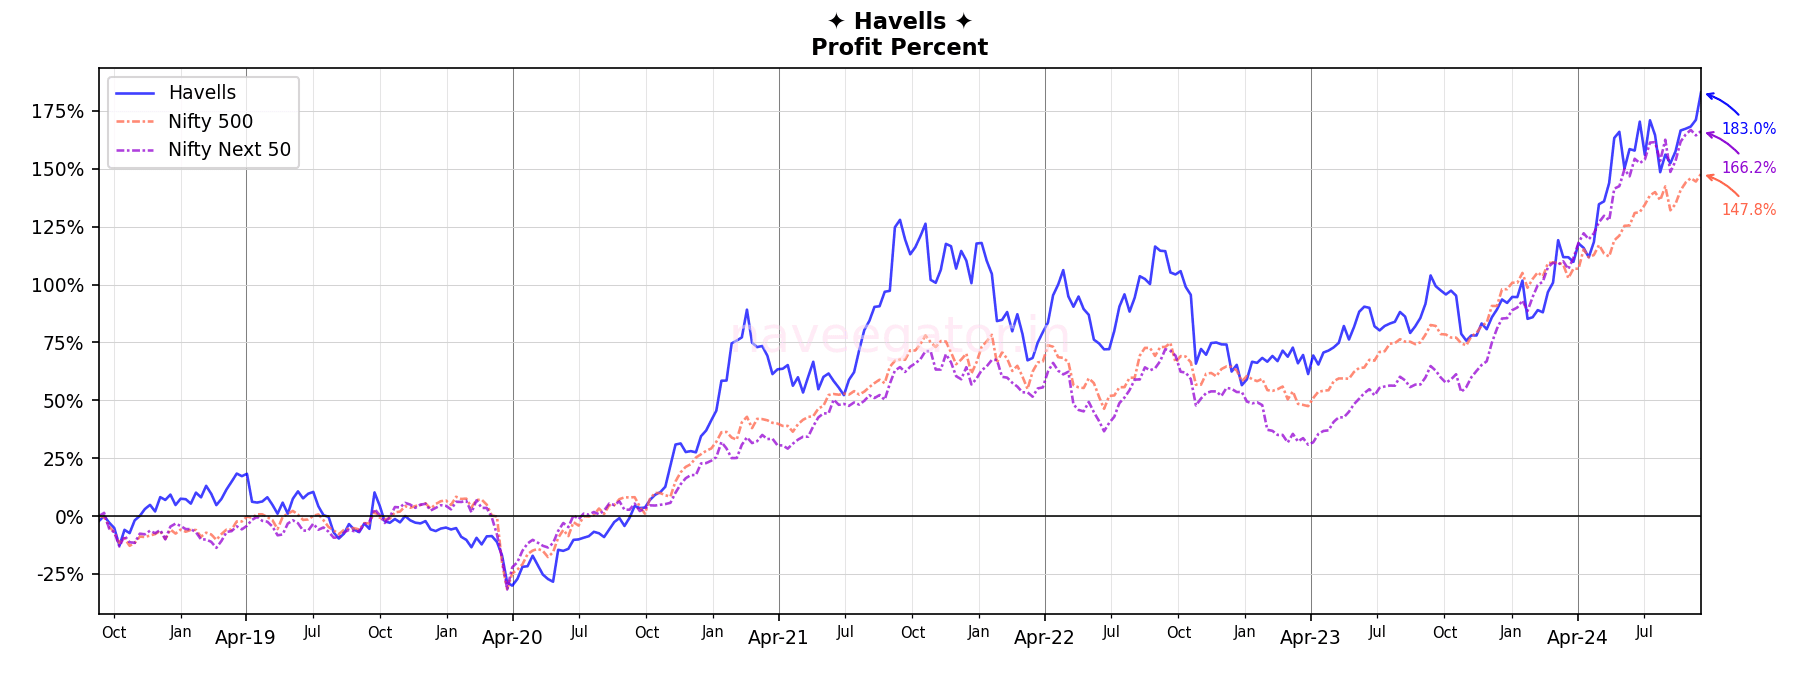
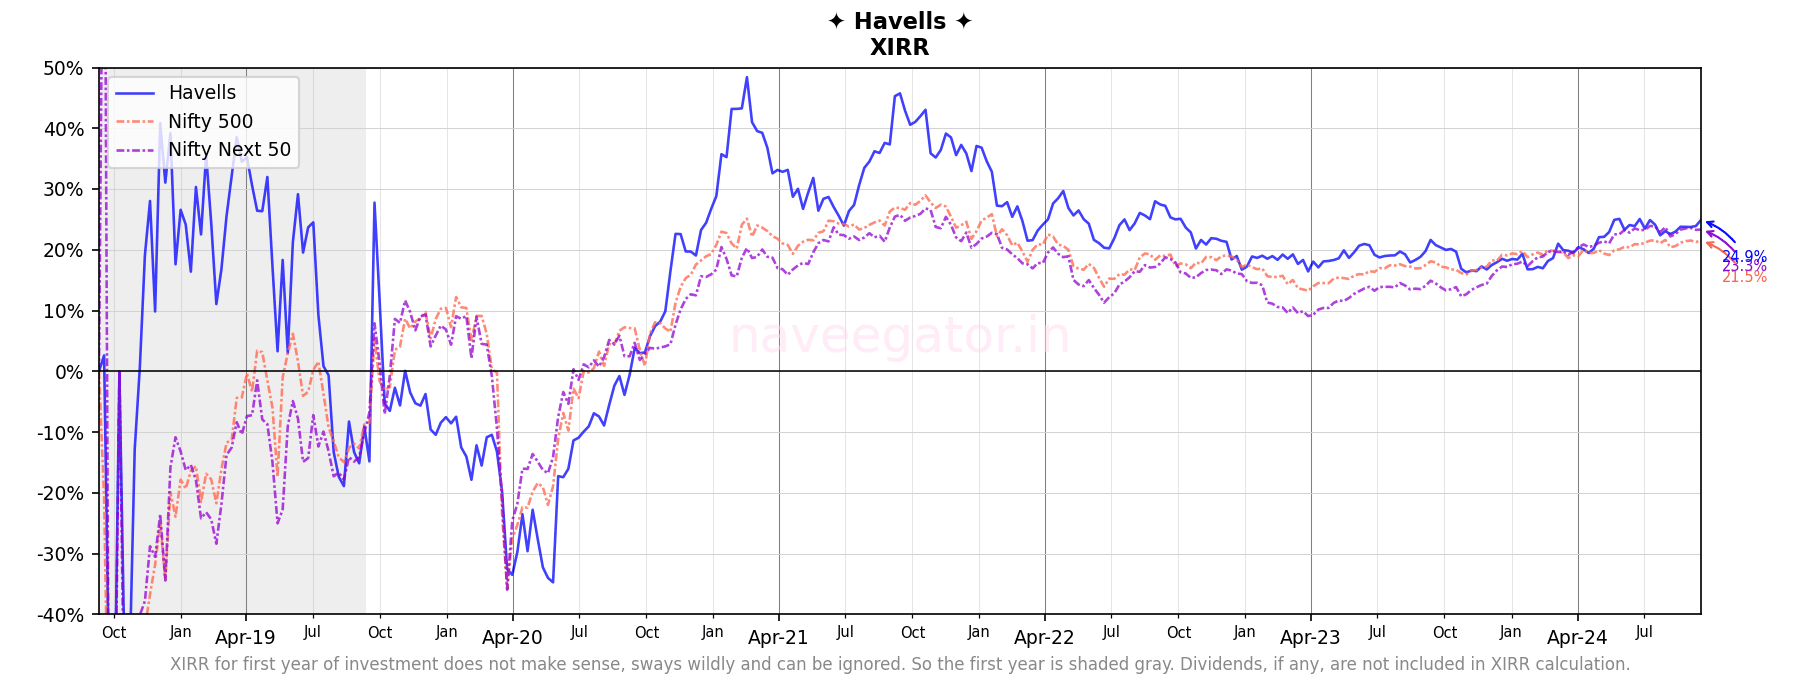
Over the years, Polycab turned out to be more than just a lucky bet. The wires and cables space might not sound glamorous, but Polycab made it exciting for me. By mid-2023, my investment had returned close to 500% (Figure 2), and the XIRR (Figure 1) was hovering around 70%—the kind of performance I’d only dreamt about.

Then came the curveballs.
First, in late 2023, Polycab got hit with allegations of a ₹200 crore tax evasion. The stock corrected sharply. Overnight, my paper profits shrank, and my XIRR dropped from 70% to 55% (Figure 1), while total gains fell from 500% to around 350% (Figure 2). That wasn’t easy to watch, but I decided to hold on. Why? Because these were just allegations, and investigations were still ongoing. I had no clue whether they were true or not—and to be honest, I still don’t. So, I chose to do nothing.
Second, big names like the Aditya Birla Group and Adani Group have thrown their hats into the wires and cables ring. This kind of competition will almost certainly eat into Polycab’s market share. The share price has been under pressure, and along with FII sell offs, it’s eroded a significant portion of my paper profits.
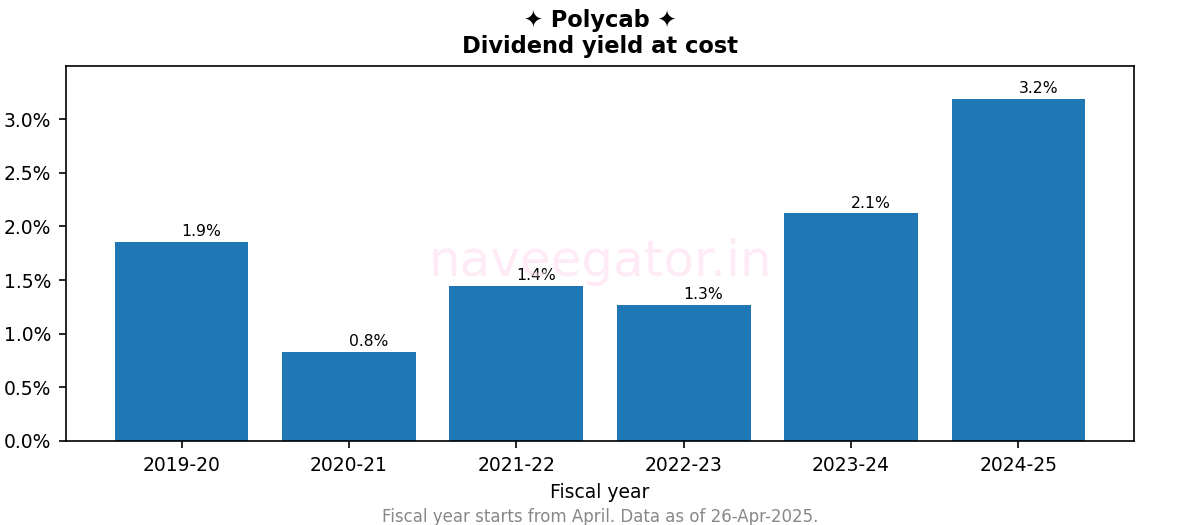
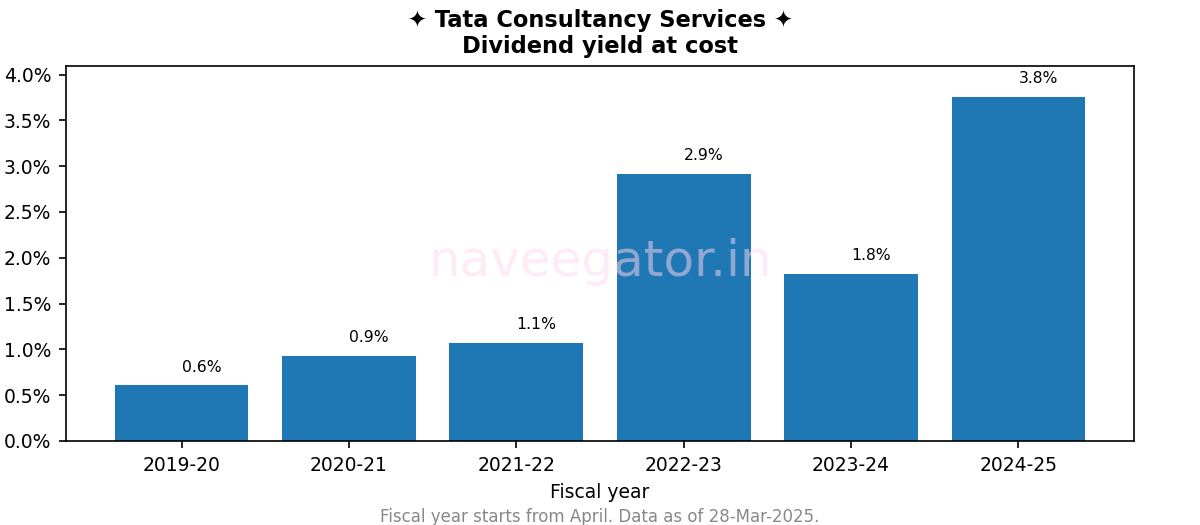
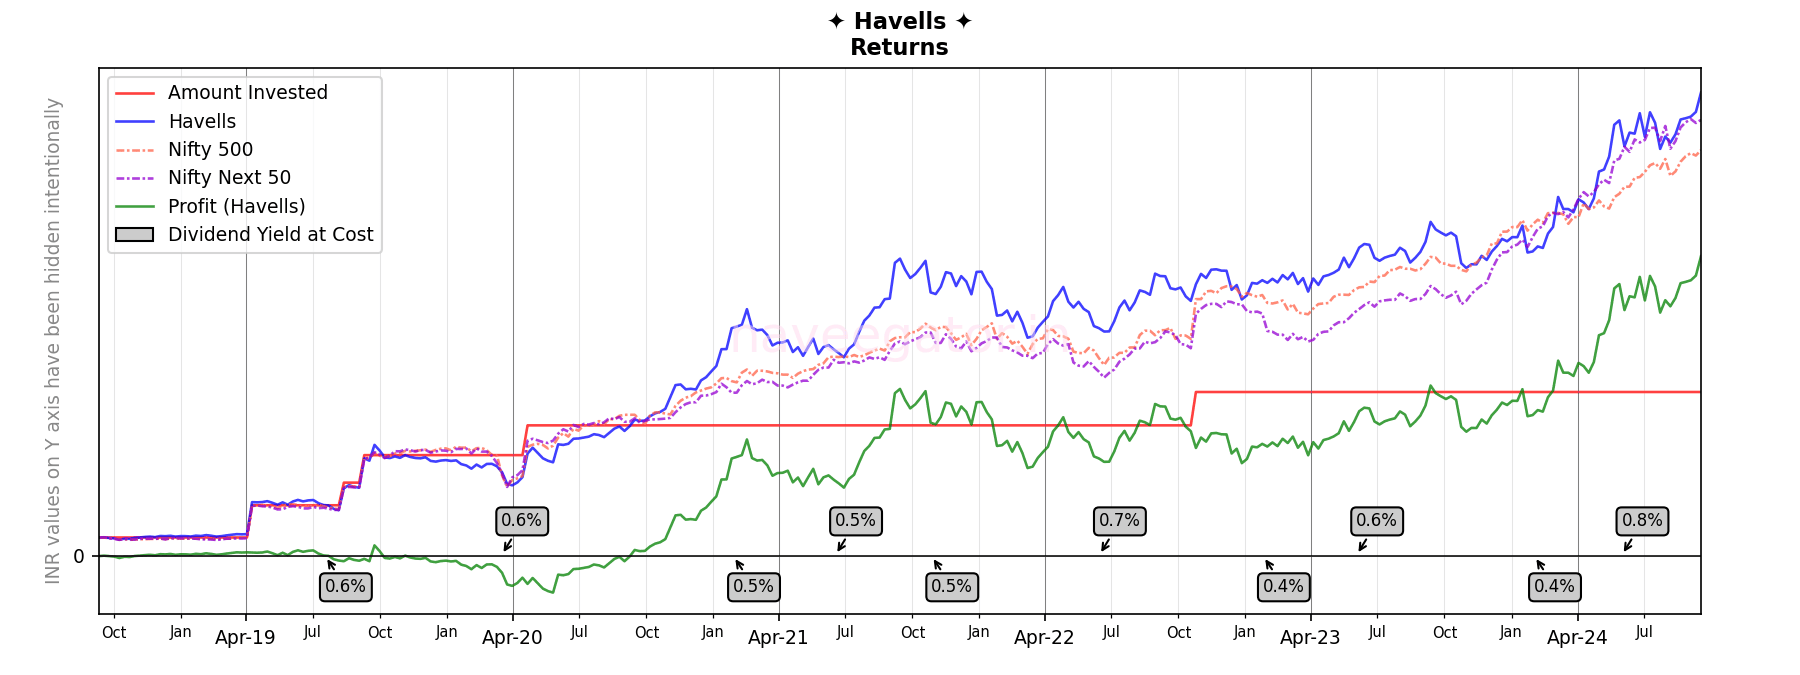
One good thing about my investment in Polycab is the dividend yield (Figure 3). In FY 2024–25, it offered a yield at cost of 3.2%, which is quite decent.
When I reflect on the last six years, Polycab has taught me a lot—about patience, conviction, and that at times being ignorant helps. But the real test lies ahead.


You must be logged in to post a comment.