I was trying to understand the historical stock composition of indices like Nifty50. I tried searching the data on the internet but couldn’t find anything. After posting my query on multiple forums, I got a direction from my query on Money StackExchange.
NSE provides the historical stock composition on Nifty 50 and Nifty Next 50 indices on Nifty Indices by selecting “Archive of Daily/Monthly Reports → Market Capitalisation, Weightage, Beta for Nifty 50 and Nifty Next 50”. However, the data is shared month-wise and not consolidated. I wrote some quick and dirty utilities to scrape off data and consolidated it in a Google Sheet.
In the ‘Nifty 50’ and ‘Nifty Next 50’ worksheets, you can see when a stock entered and exited the index (e.g., Axis Bank joined the Nifty 50 in March 2009). The ‘Nifty 50 Data’ and ‘Nifty Next 50 Data’ worksheets contain the raw data downloaded from the website.
Seven years ago, when I first invested in VIP Industries, I had no idea what kind of journey I was embarking on. Although VIP Industries represents less than 2% of my direct equity portfolio— even less when considering mutual funds—it has taught me valuable lessons about investing.
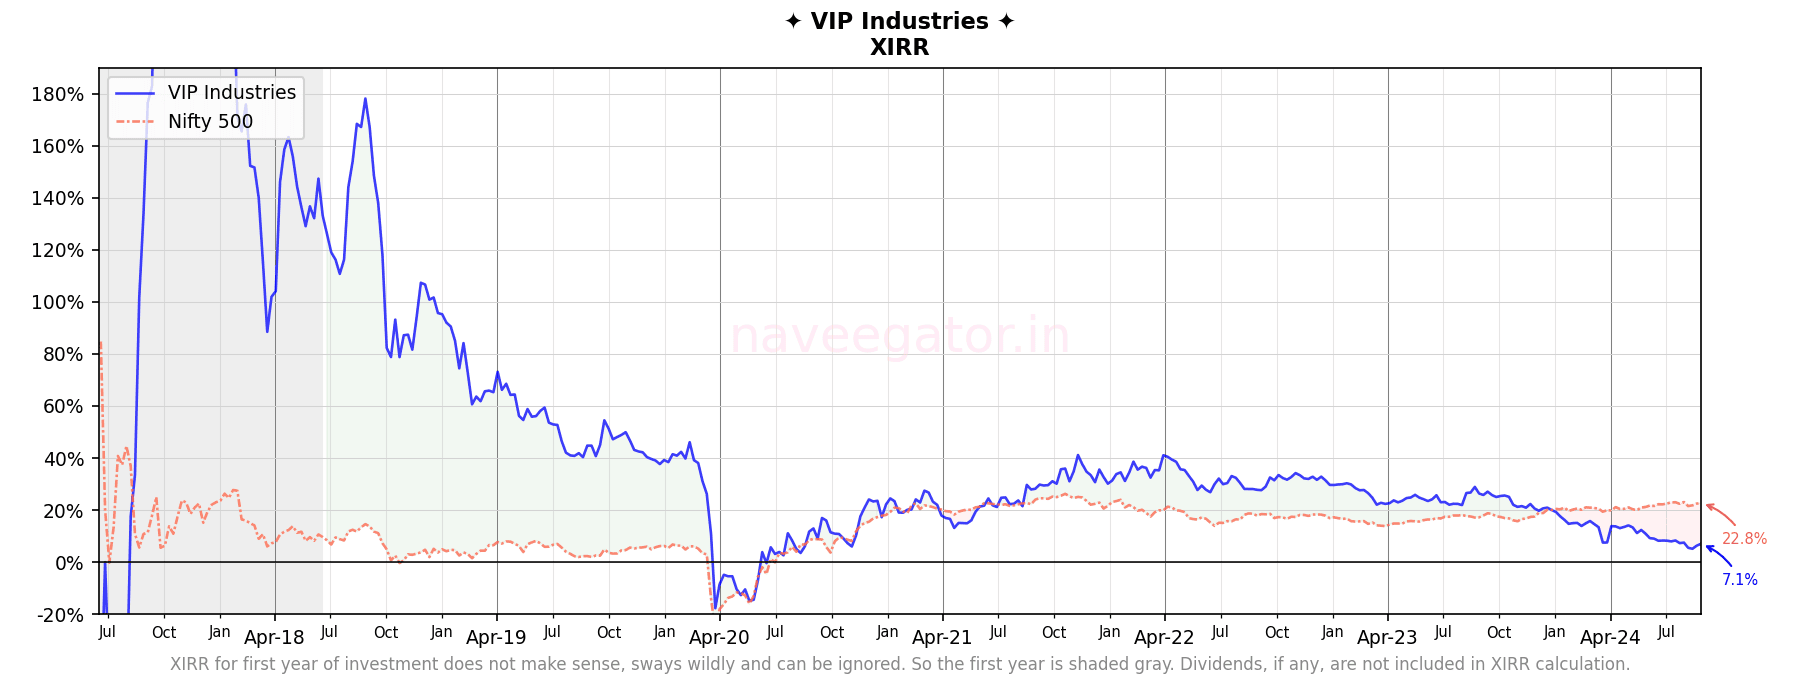
First, volatility. We’ve all heard countless times that stocks are volatile, but nothing prepared me for how true that would be with VIP Industries during the Covid pandemic. In just one month, my investment went from a 170% profit to a 20% loss.
Second, beginner’s luck versus long-term reality. When you start investing, you often experience beginner’s luck, where your investments outperform your expectations. VIP Industries was no exception, delivering impressive returns for the first two and a half years. Even the post-Covid recovery was remarkable, with an XIRR of 40%. But then, reality sets in—a reality where the former Managing Director leaves for a primary competitor, causing a shift in the industry.
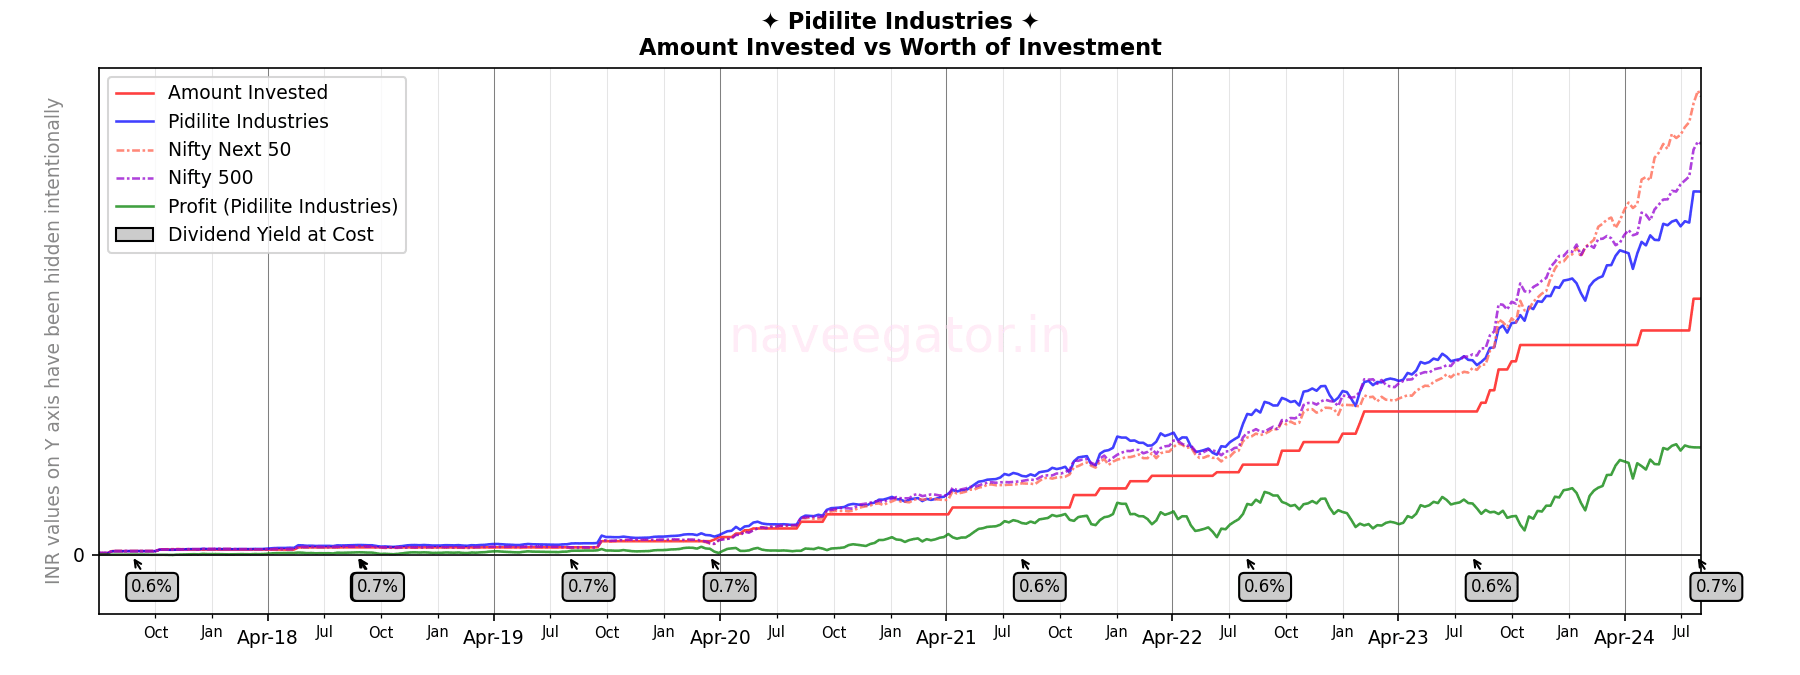
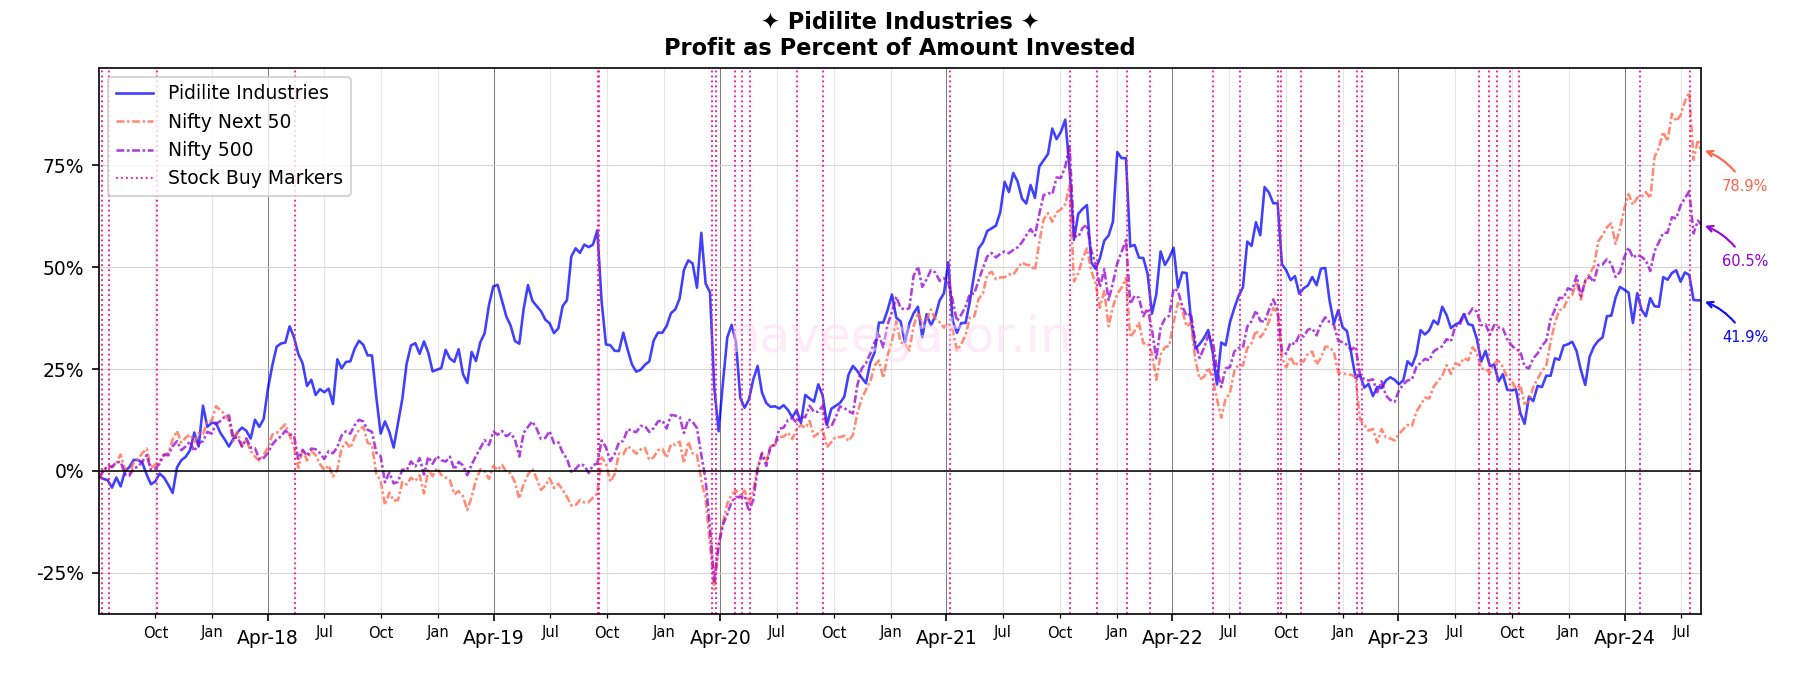
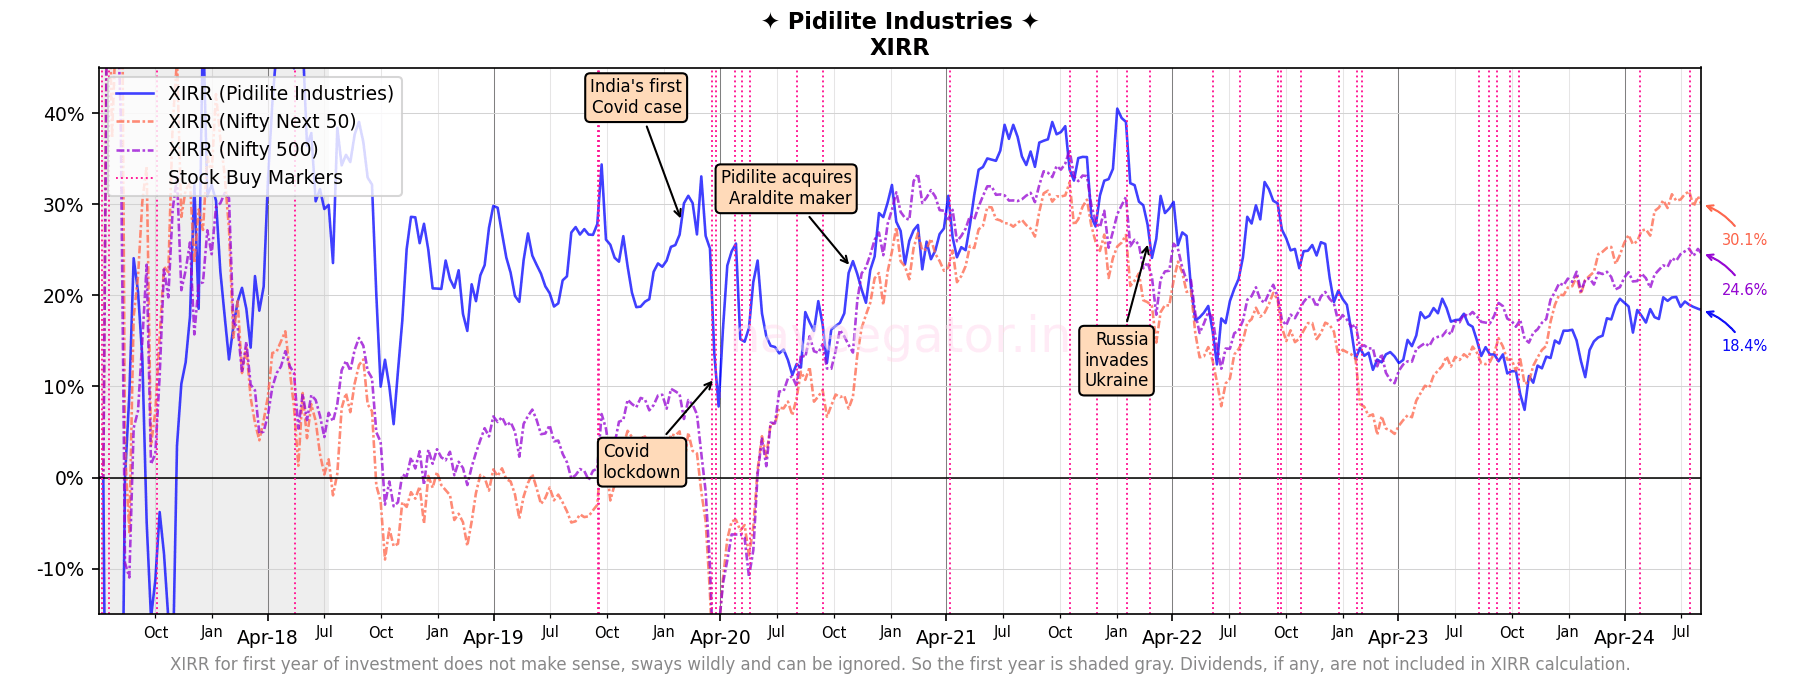
Pidilite remains a key investment in my portfolio. However, after nearly six years of outperforming the index, my luck ran out in October 2023. Both the Nifty Next 50 and Nifty 500 surpassed my returns from Pidilite. Although Pidilite’s XIRR of 18.4% is impressive, it pales in comparison to the Nifty Next 50’s 30.1% XIRR. Additionally, the dividends yield at cost remain meager at less than one percent.
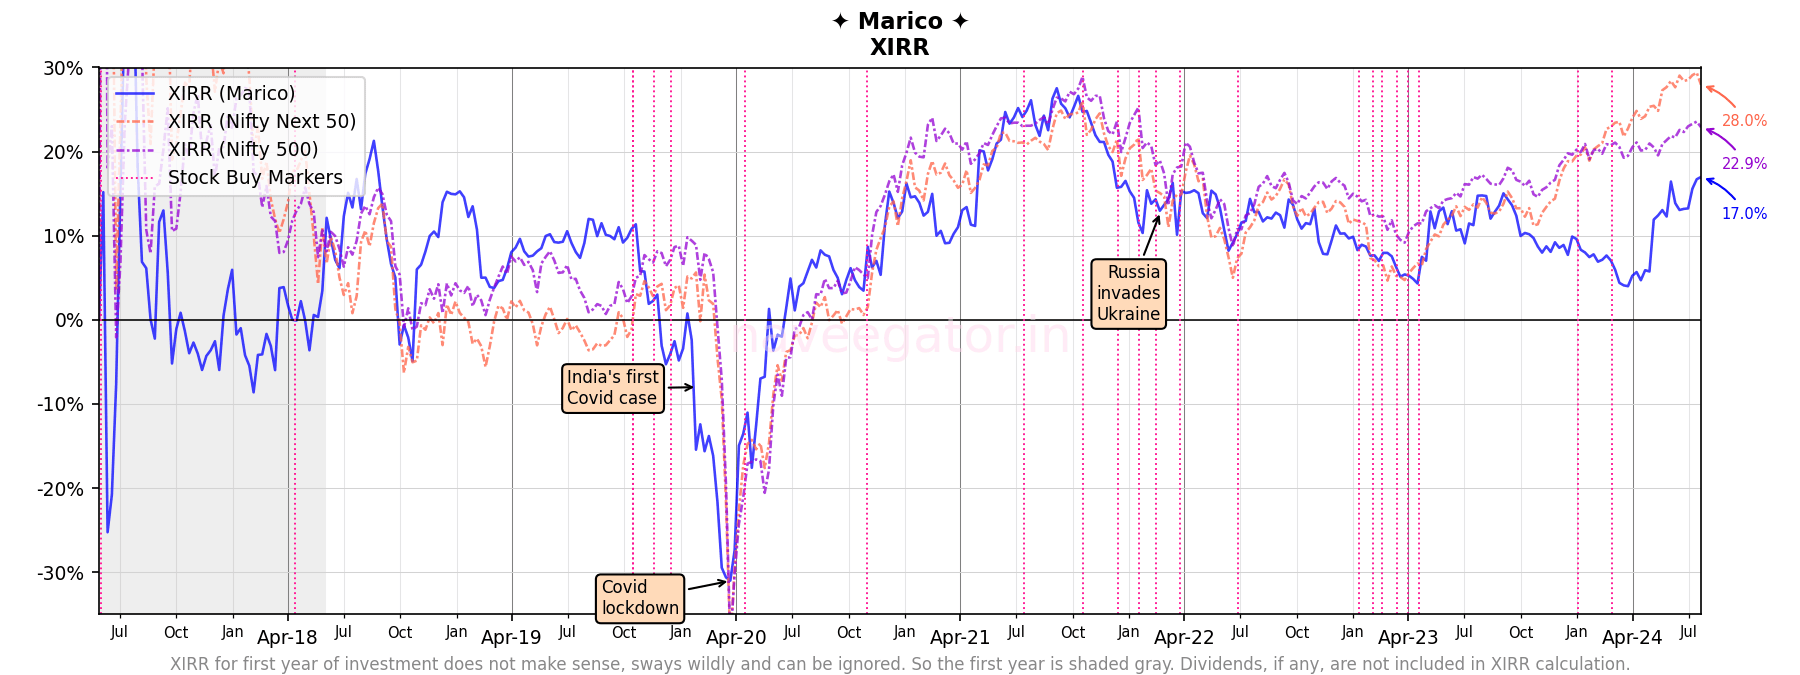
In the seventh year of my investment journey with Marico, beating index continues to be an elusive dream. And with the recent run up in the Nifty Next 50 index since last one year, I think it might be even more elusive now.
While Marico’s XIRR at 17% looks good, the XIRR of 22.9% and 28% of Nifty 500 and Nifty Next 50 index respectively looks better. And with LTCG revised to 12.5%, any additional return will mean more post-tax return.
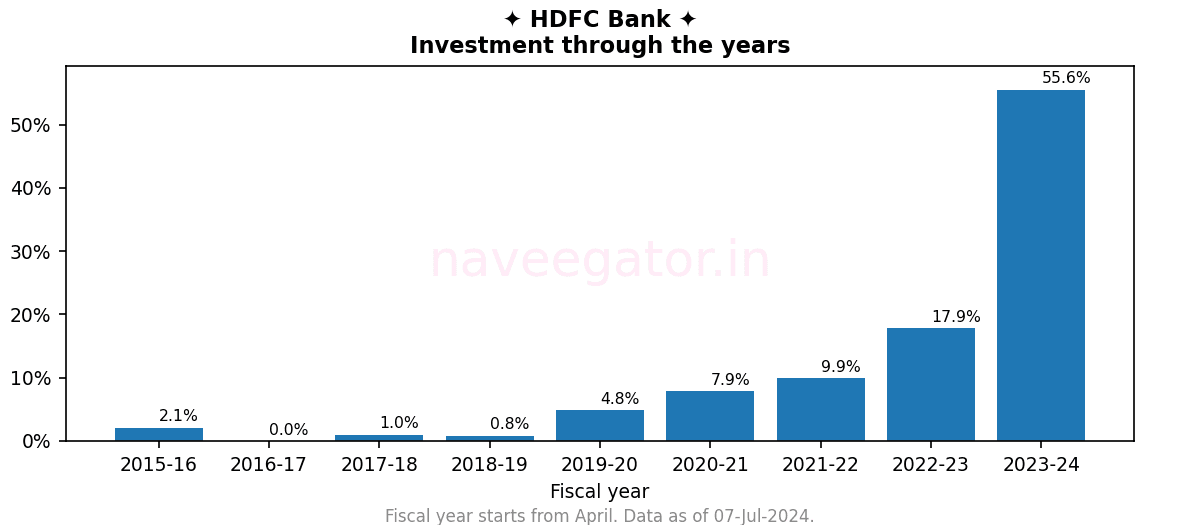
It has been nine years since I started investing in HDFC Bank, and I still can’t call myself a long-term investor. Why? Because in the fiscal year 2023-24, I invested more than I had in the previous eight fiscal years. Why such a significant increase? Well, my earnings were higher, and HDFC Bank was going through a slump. I decided to take a risk by investing during that slump.
Consider this: My investment during the first five fiscal years amounts to less than 10% of my entire investment in HDFC Bank. If—and that’s a big if—my earnings increase in the future, this percentage will decrease further.
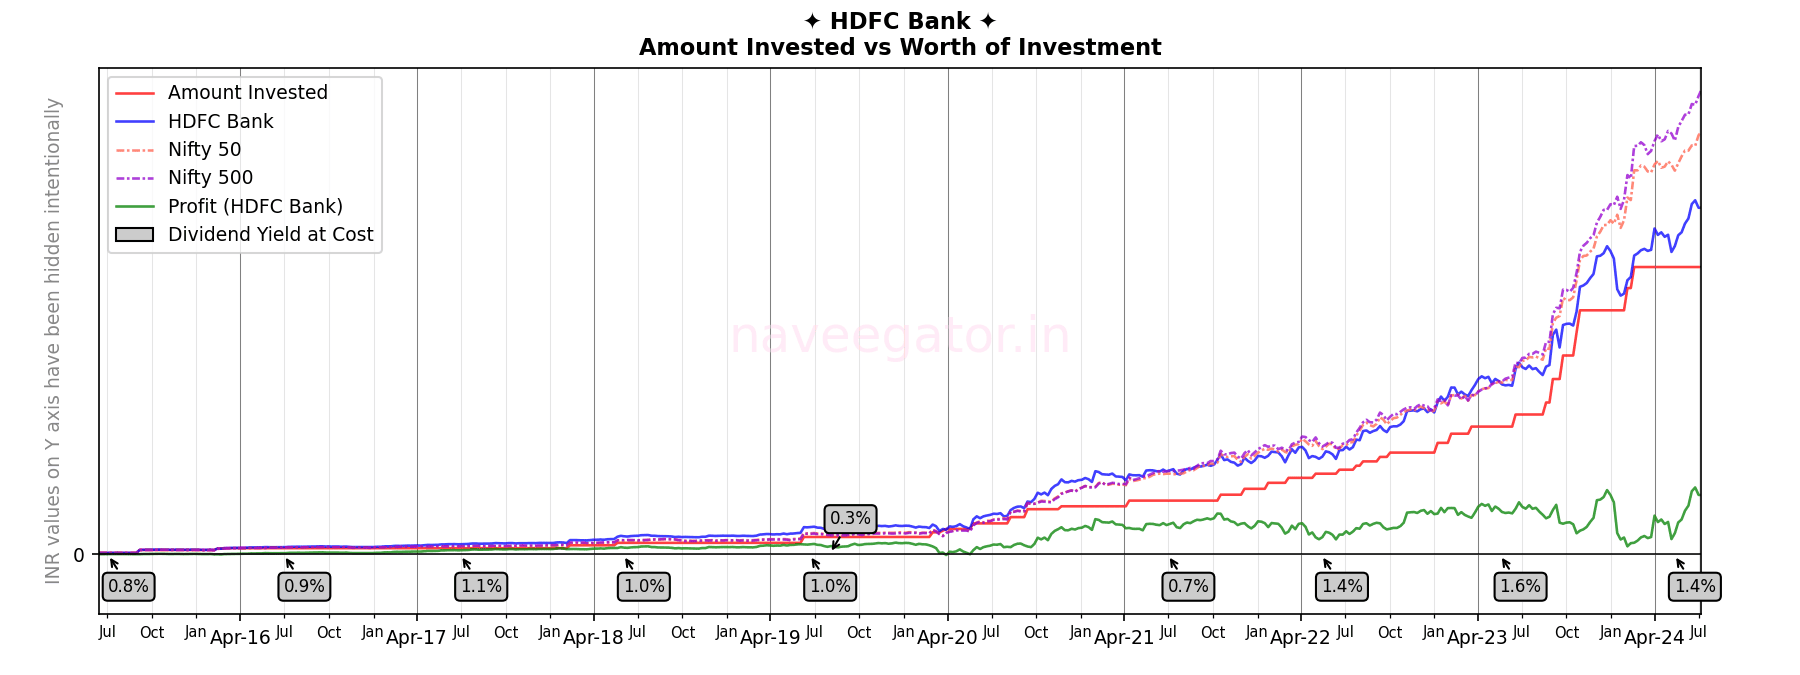
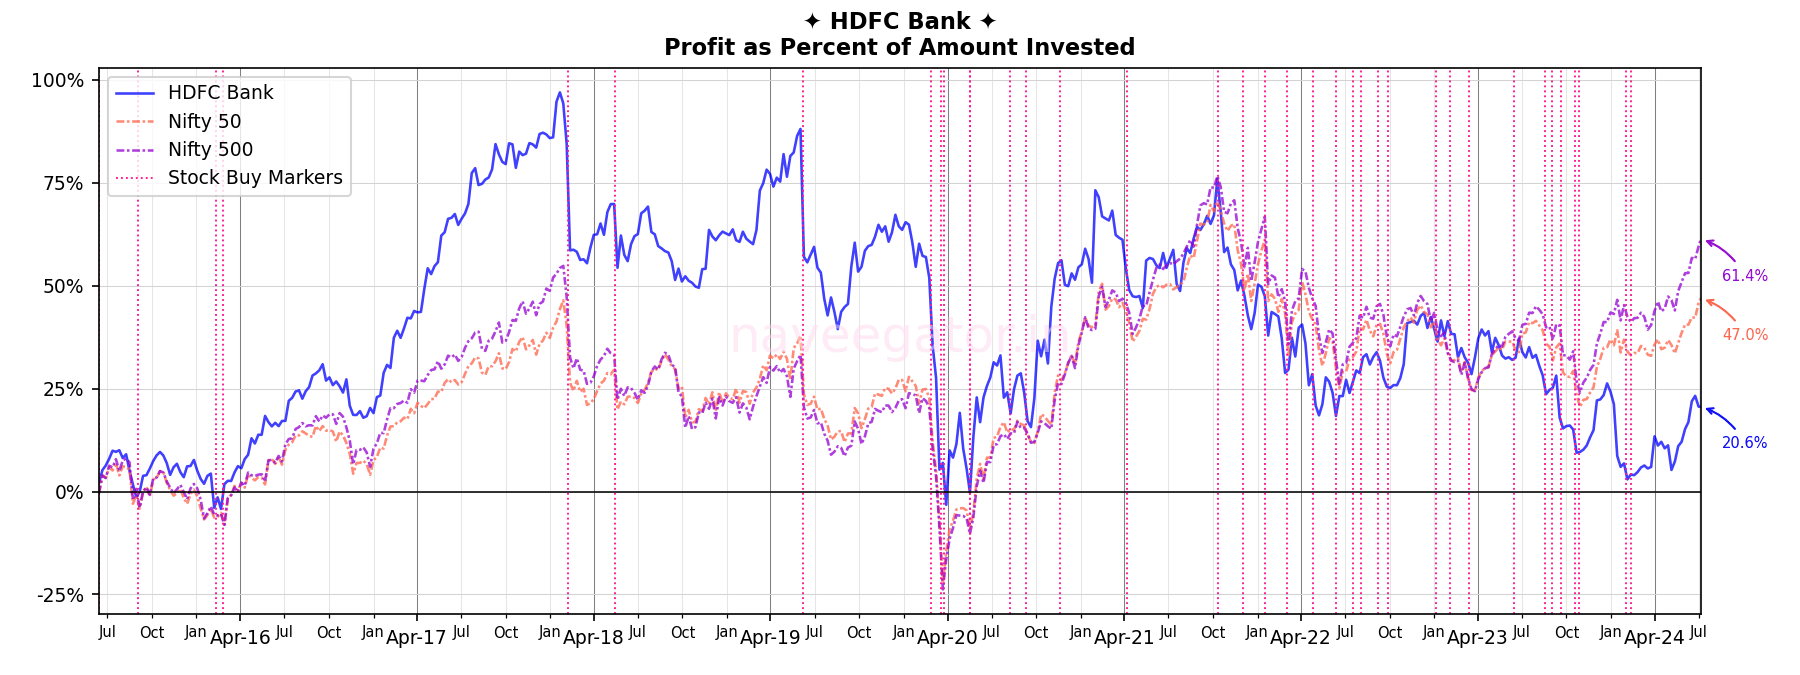
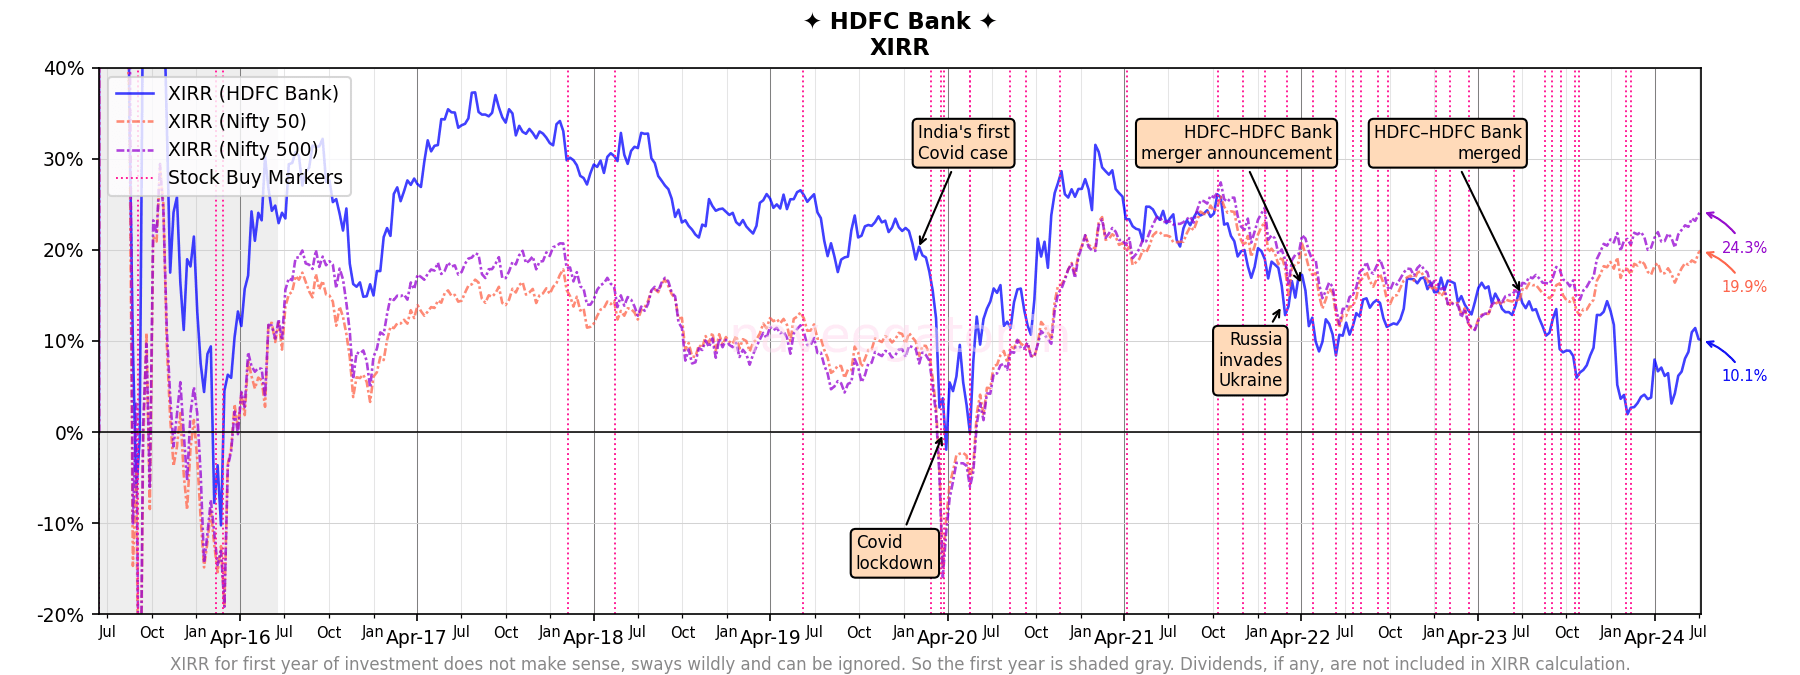
After outperforming Nifty 50 and Nifty 500 during the initial years, my returns have taken a nosedive primarily due to the merger of HDFC and HDFC Bank. The merger seems to have added a lot of concerns for HDFC Bank. Concerns which I simply can’t wrap my head around because they are too technical for me.
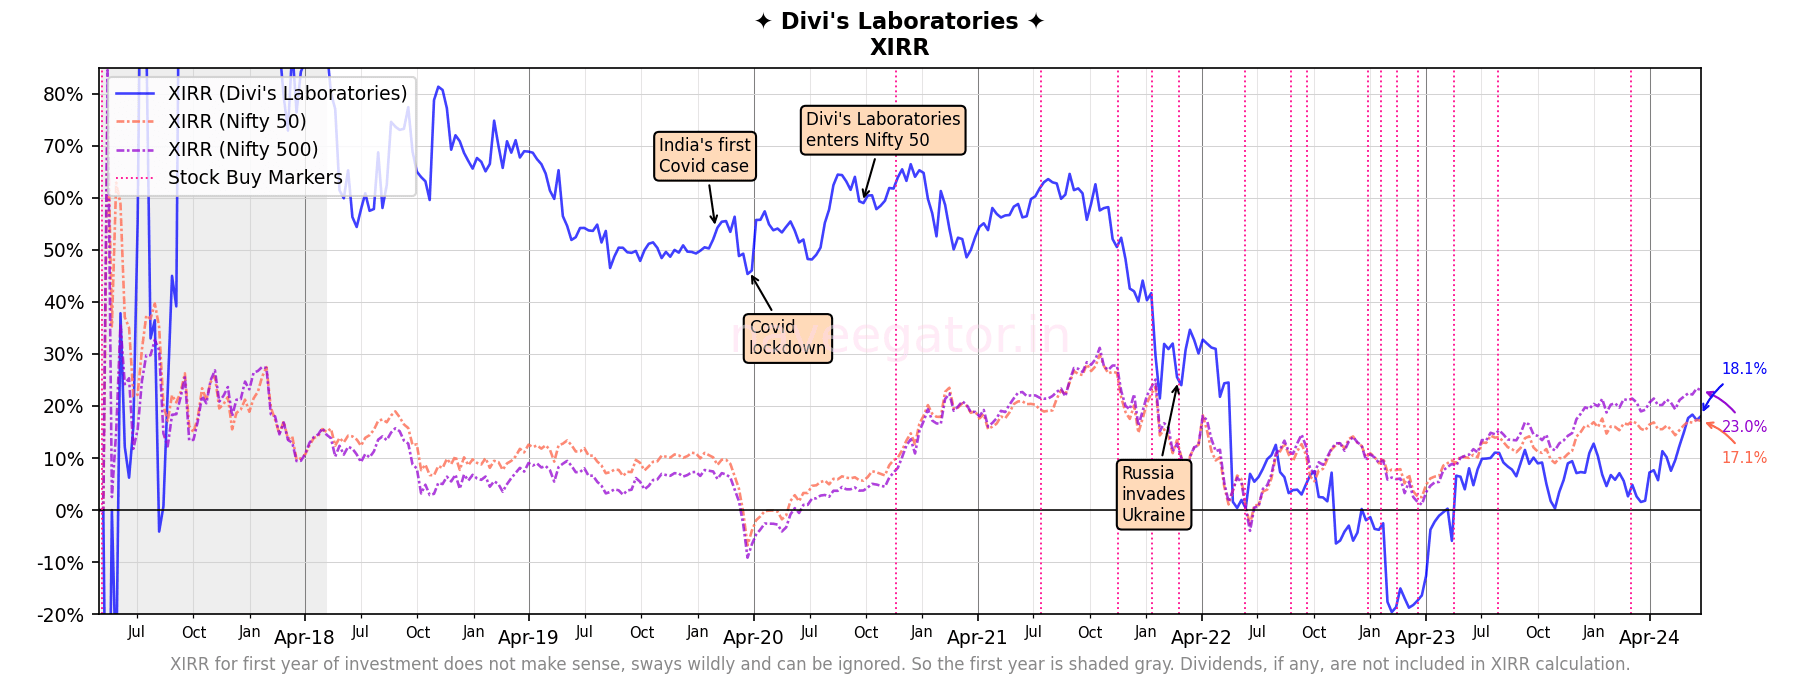
My investment in Divi’s Laboratories has been my biggest missed opportunity. Six years back—still new to equity investing—I was looking for Pharma stocks to invest. During that research—not sure if I should call it research, but let’s go with it—I came across Divi’s Laboratories. I made a small investment in it and forgot about it. In the next 3.5 years the stock went up 5 times! And I did not make a single new investment during that time! Every time I thought “it can’t go up any further than that”. Boy was I wrong. So, so wrong!
Since FY 2020-21, I have slowly started increasing my investments in Divi’s Laboratories. But the stock—on the other hand—has been volatile. During April’23 the stock went on a downward spiral and my XIRR went to -20%. What happened at that time? Finshots has an explanation for that.
Over the last fiscal year Divi’s Laboratories has slowly recovered and is now beating Nifty 50 by a razor thin margin. Yay! Hopefully this recovery continues.
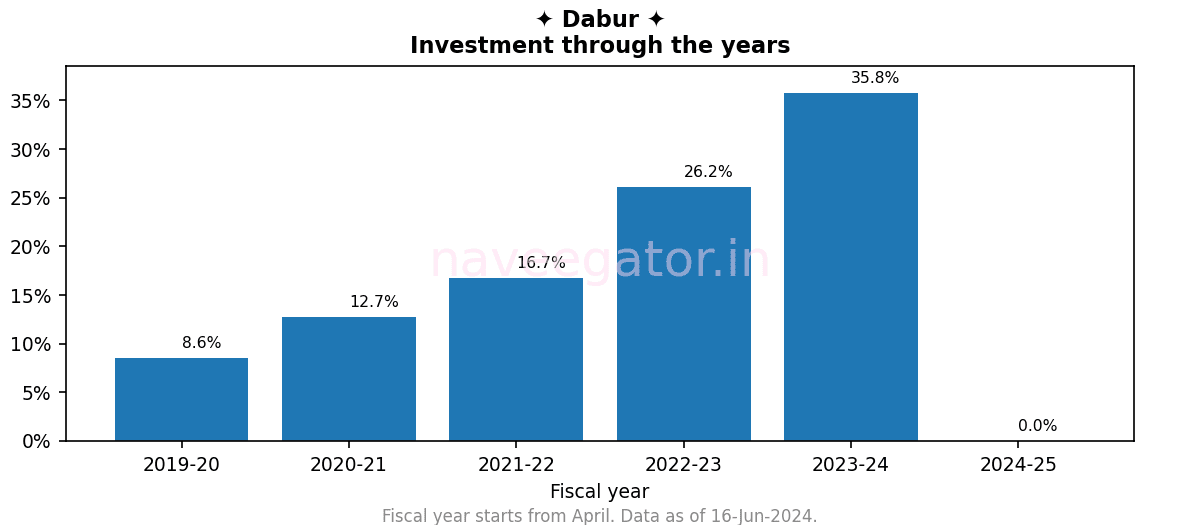
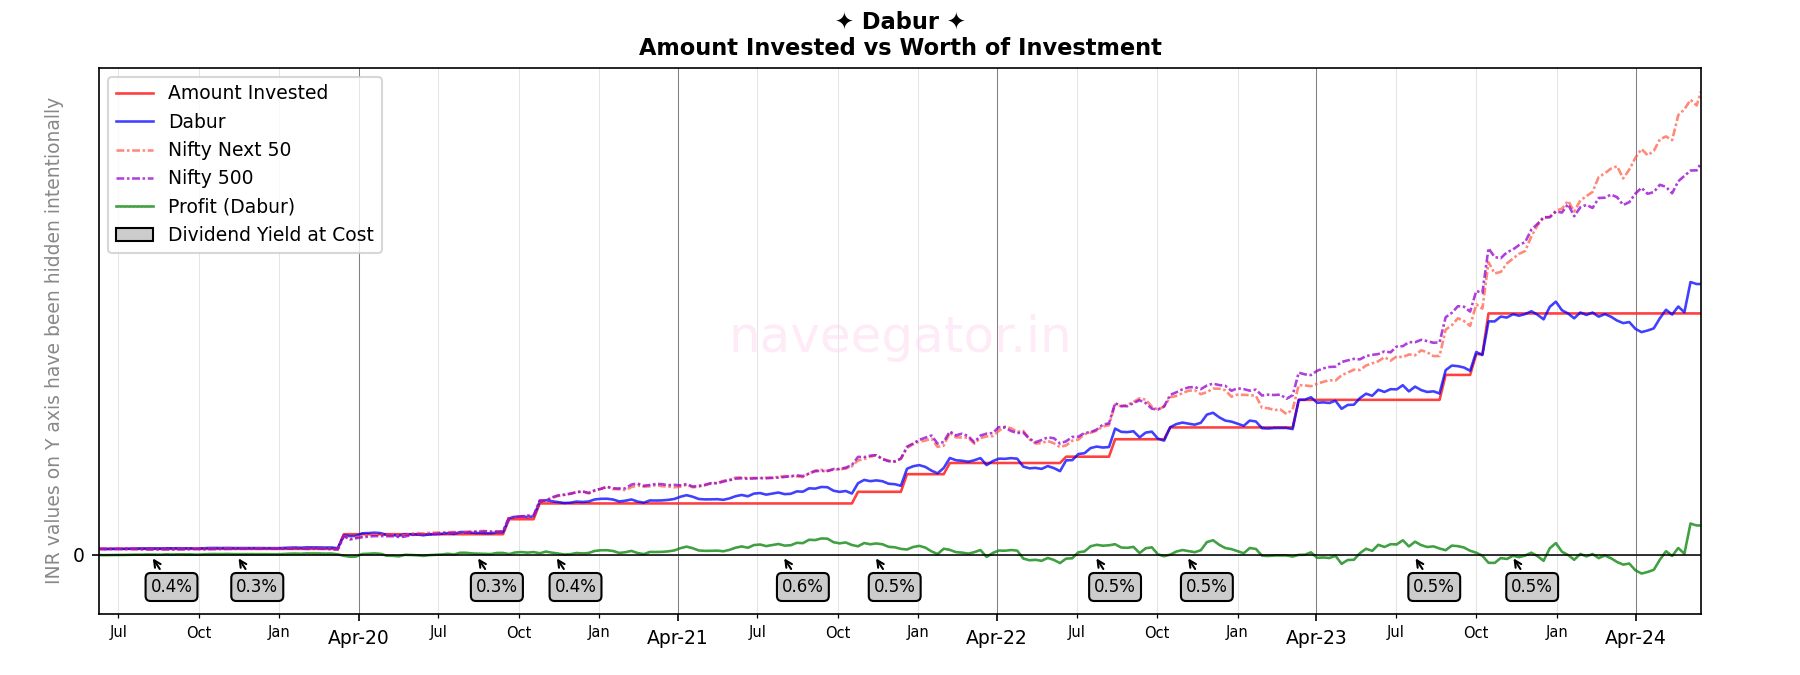
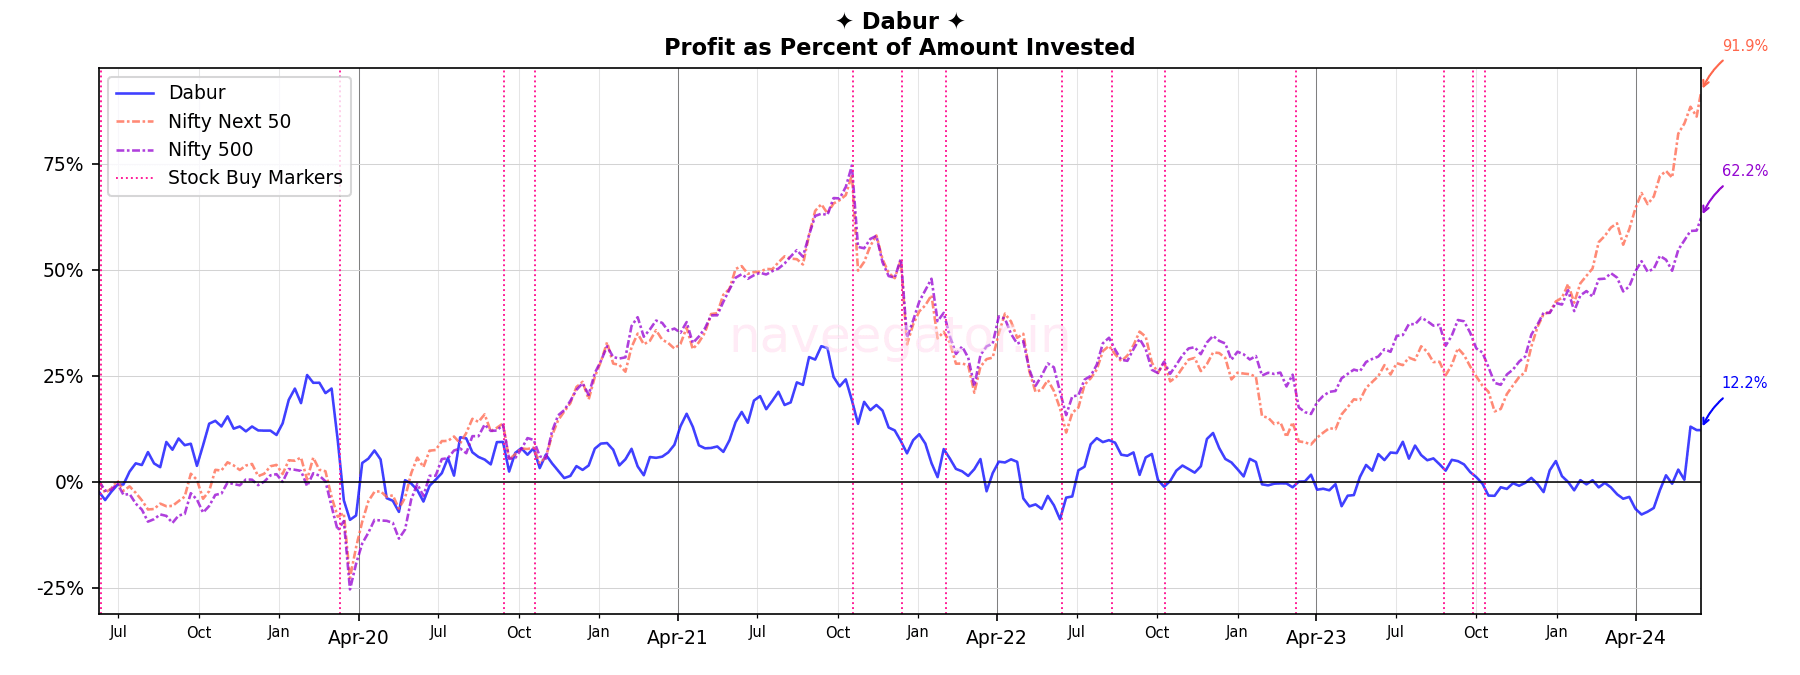
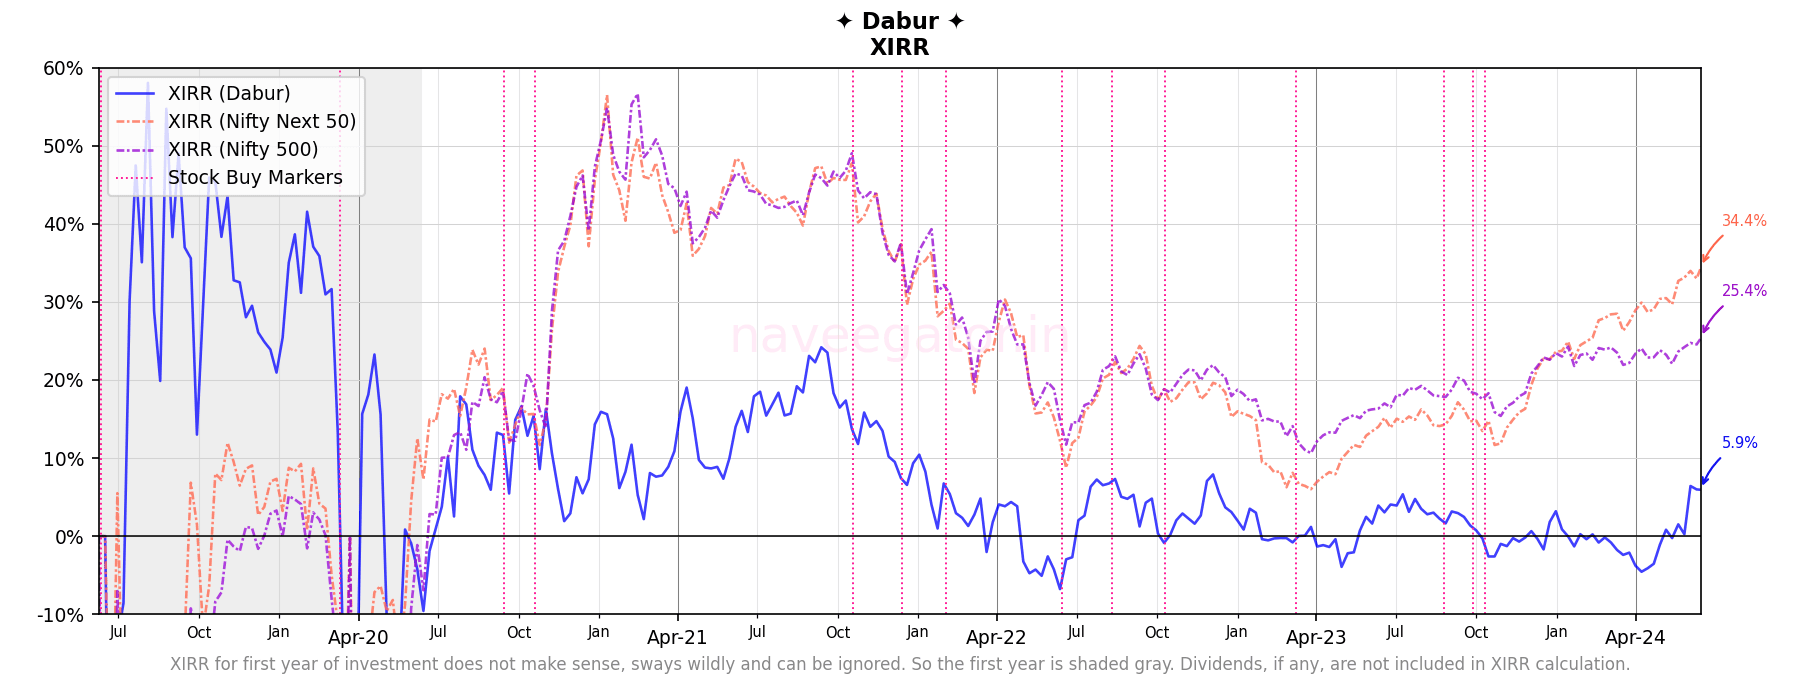
Over the last five years I have steadily increased by investment in Dabur. The stock—on the other hand—has gone sideways, zig-zagging between positive and negative sides of zero; never truly rising up and—thankfully—never crashing drastically.
There is really nothing to write about here apart from my anxiety about holding a stock for long term.
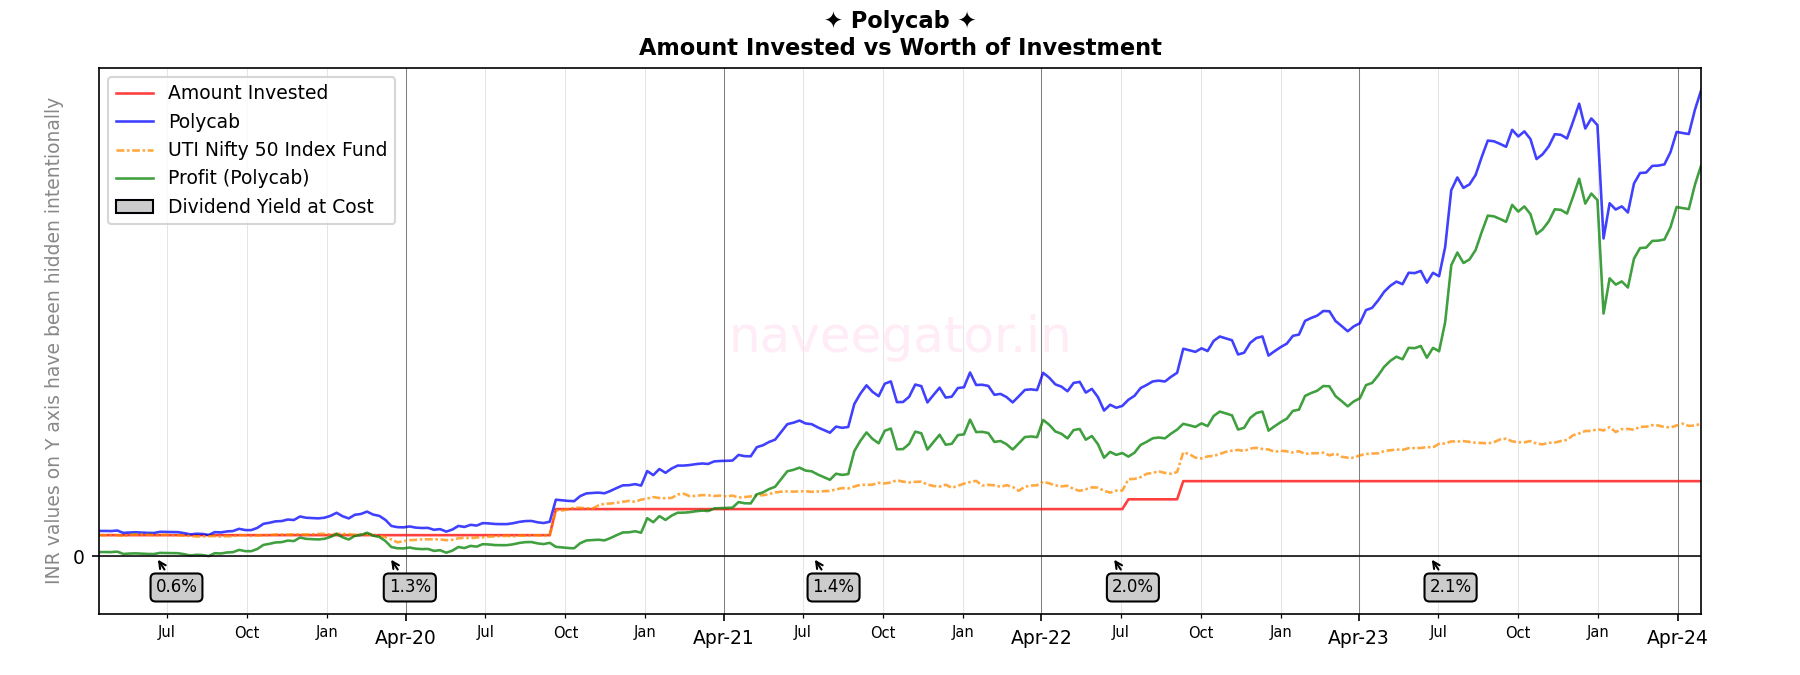
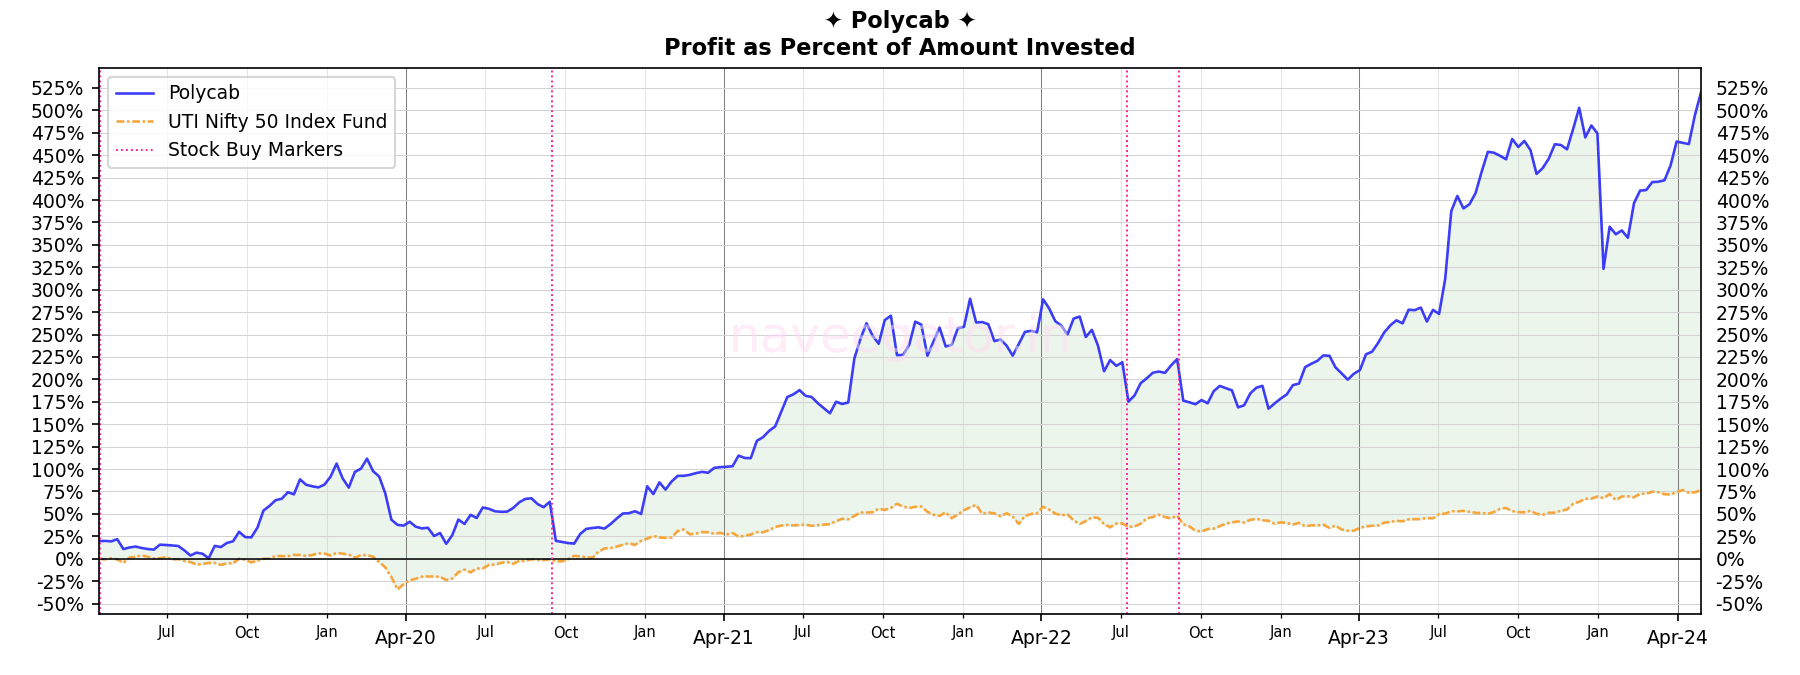
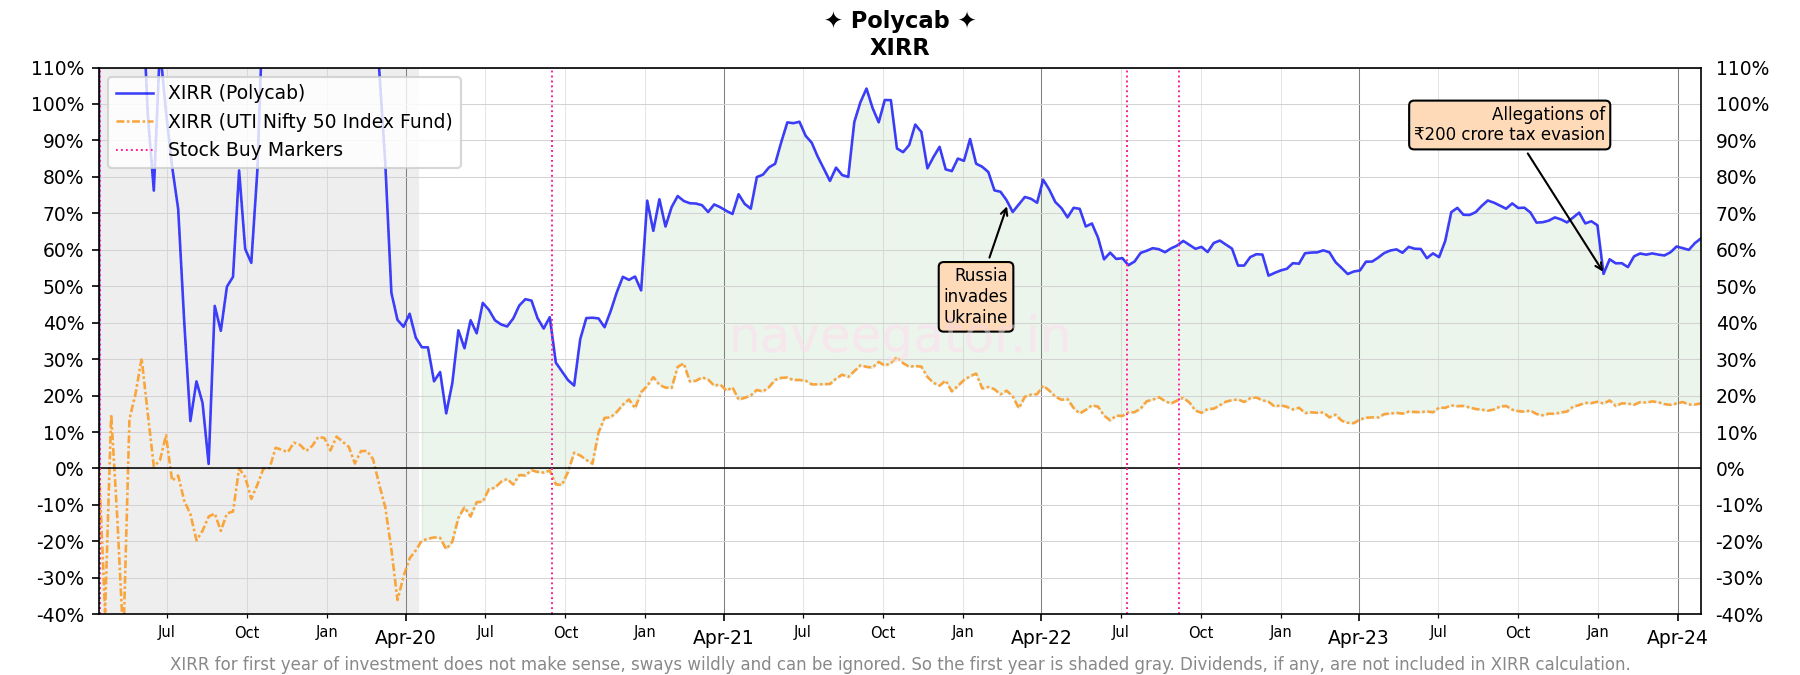
In 2024, my investment in Polycab took me on a roller coaster ride. Early in the year, allegations of ₹200 crore tax evasion were leveled against the company. As a result, the stock plummeted from ₹5,400 to ₹3,800. I felt like my golden goose was dying. My profit dropped from 500% to 325%, which, while still impressive, felt disappointing compared to the initial gains. Unsure whether the allegations were true, I grappled with the decision: should I sell Polycab and secure a gain of over 300%? Ultimately, I chose to do… nothing. I sat there, eyes closed, waiting. Remarkably, four months later, Polycab has fully recovered its lost gains. But the mystery remains: were the allegations true or false? And what happens if they are true?
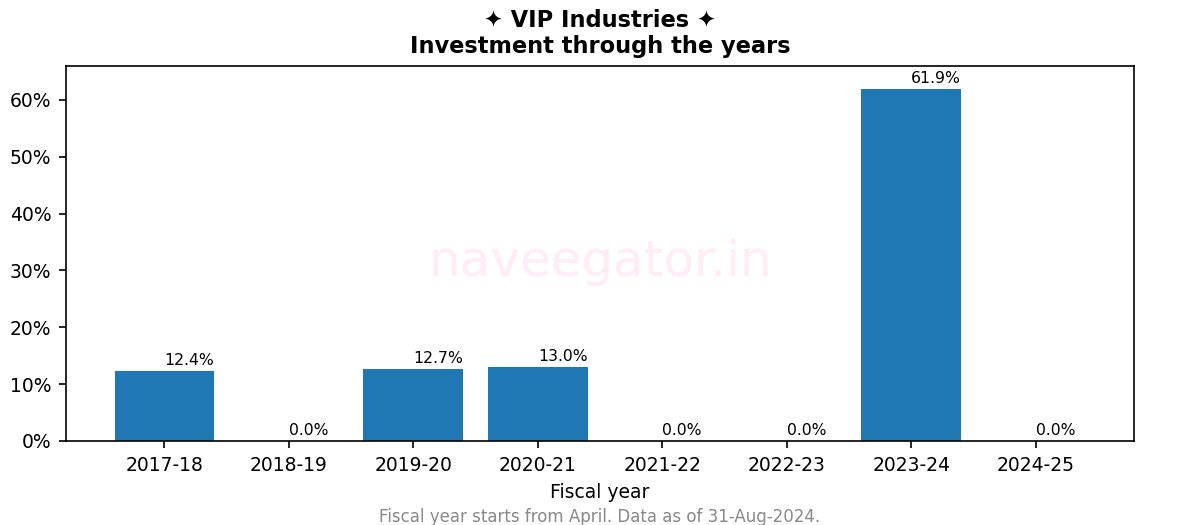
Investment through the years
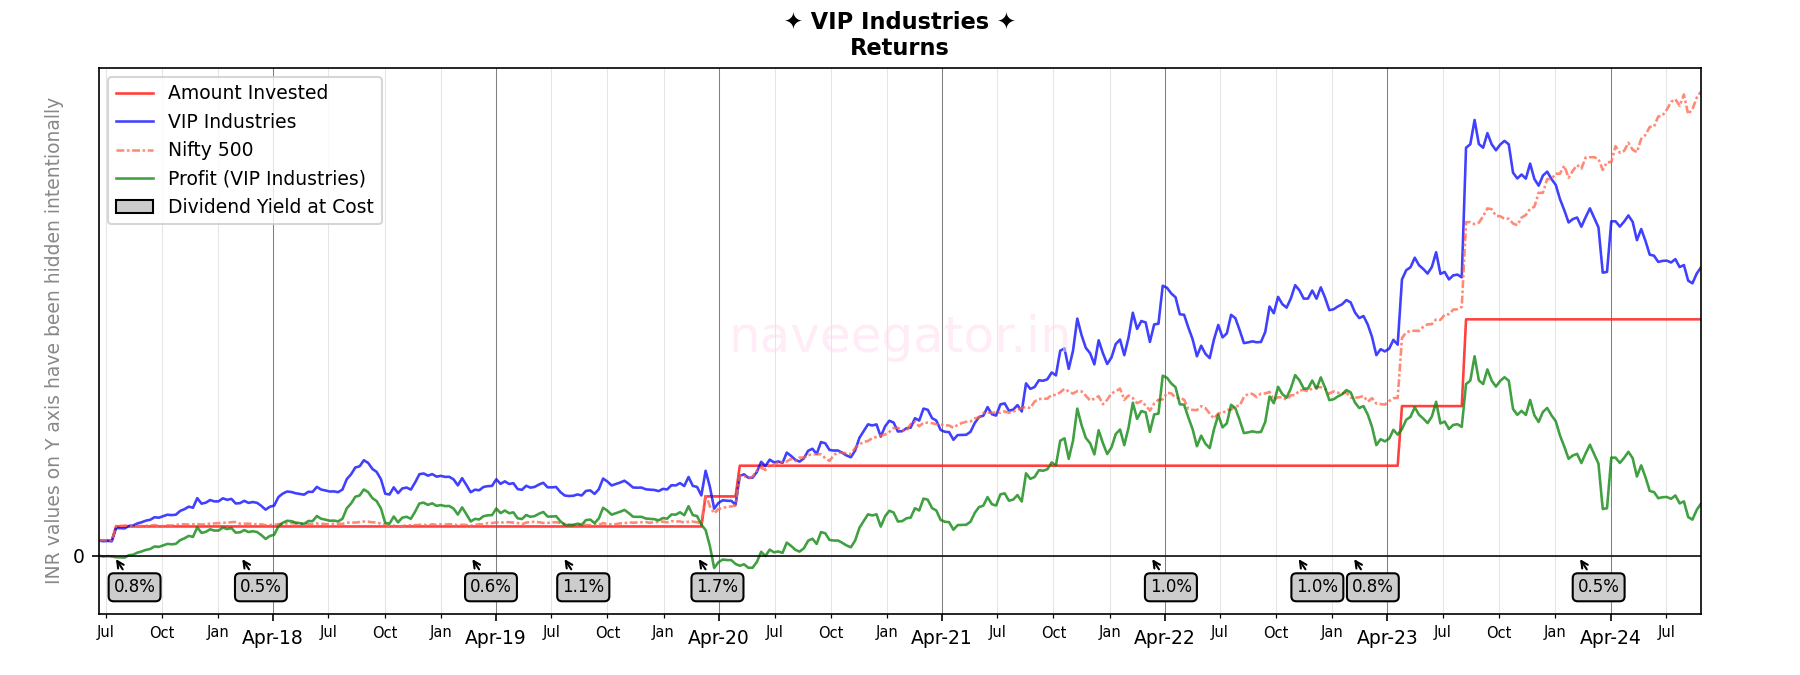
Returns
Fiscal year
Dividend yield at cost
2019-20
1.86%
2020-21
0.00%
2021-22
1.45%
2022-23
1.27%
2023-24
2.13%
2024-25
0.00% *
* Data as of 4-May-2024
The dividend yield at cost mentioned in the Returns graph above, is yield at the date at which I received the dividends. Another way to look at dividend yield is to calculate it for the fiscal year. To calculate the dividend yield at cost in the above table I use the below formula. (Total amount of dividends received in a fiscal year ÷ Total amount invested at the end of fiscal year) × 100
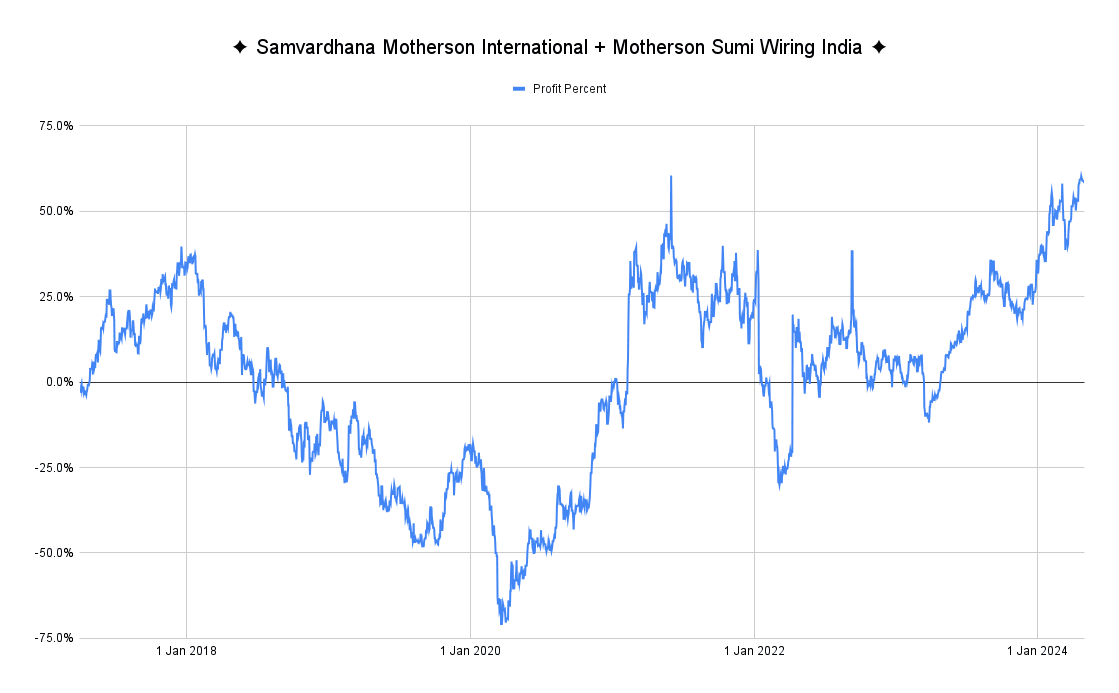
Seven years ago when I started investing in Samvardhana Motherson International Ltd, it was called Motherson Sumi Systems Limited. Over last seven years the company split its wiring business into another entity called Motherson Sumi Wiring India Limited and renamed itself to Samvardhana Motherson International Ltd.
When Motherson Sumi Wiring Ltd got demerged, the historical share price of Samvardhana Motherson International Ltd got adjusted to remove Motherson Sumi Wiring Ltd’s valuation (not sure if I am using the right terminology here, I am no financial expert). With that I was not able to reliably calculate the historical movement of my investment. But this time, I used the technique described here with the difference being that I used Google Sheets rather than Numbers on Mac.
Before we go see the journey, here is gist of the key events.
Date
Event
Jul 2017 from Motherson Sumi Systems Ltd
Bonus 1:2
Oct 2018 from Motherson Sumi Systems Ltd
Bonus 1:2
Feb 2022
Motherson Sumi Wiring Ltd demerges with 1:1 ratio i.e. one equity share of Motherson Sumi Wiring Ltd for every one equity share of Motherson Sumi Systems Limited
Sep 2022 from Motherson Sumi Wiring Ltd
Bonus 2:5
Sep 2022
Motherson Sumi Systems Limited renames itself to Samvardhana Motherson International Ltd
Oct 2022 from Samvardhana Motherson International Ltd
Bonus 1:2
Investment through the years
I have not invested any amount since I last wrote, so the my investment through the years looks the same as last years.
Returns
Returns and Profit Percent chart were created using Google Sheets so it would look different from my other articles. Also, you would notice that the comparison with Nifty 50 Index is also missing; I am yet to figure that out. One thing to note here is that, last year has been good for both Samvardhana Motherson International and Motherson Sumi Wiring India.
Profit Percent
Looking at profit percent, it becomes even clearer how good last year has been. Till last year I was at loss of 2.5% while this time around I am at profit of 62%!
XIRR
I cannot create XIRR chart in Google Sheet. So you will have to read the words here.
My XIRR now is at 9.5%. If I compare it to XIRR of Nifty 50 Index it would have been 15%. Although I am still behind Nifty 50 Index returns, but I think there may be a point in time in the future where my investment will beat the Nifty 50 Index. This was unimaginable for me till last year.
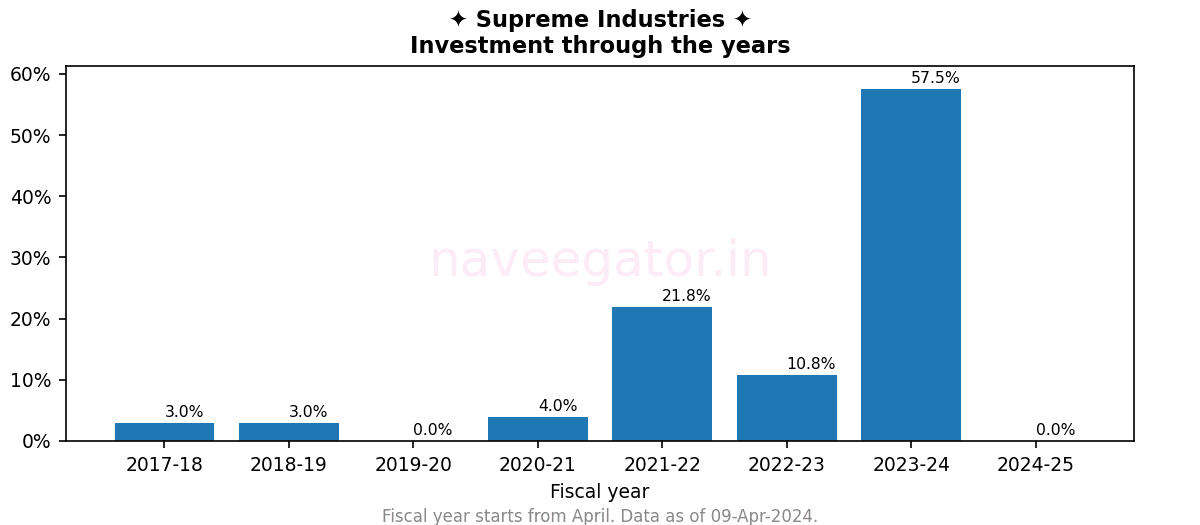
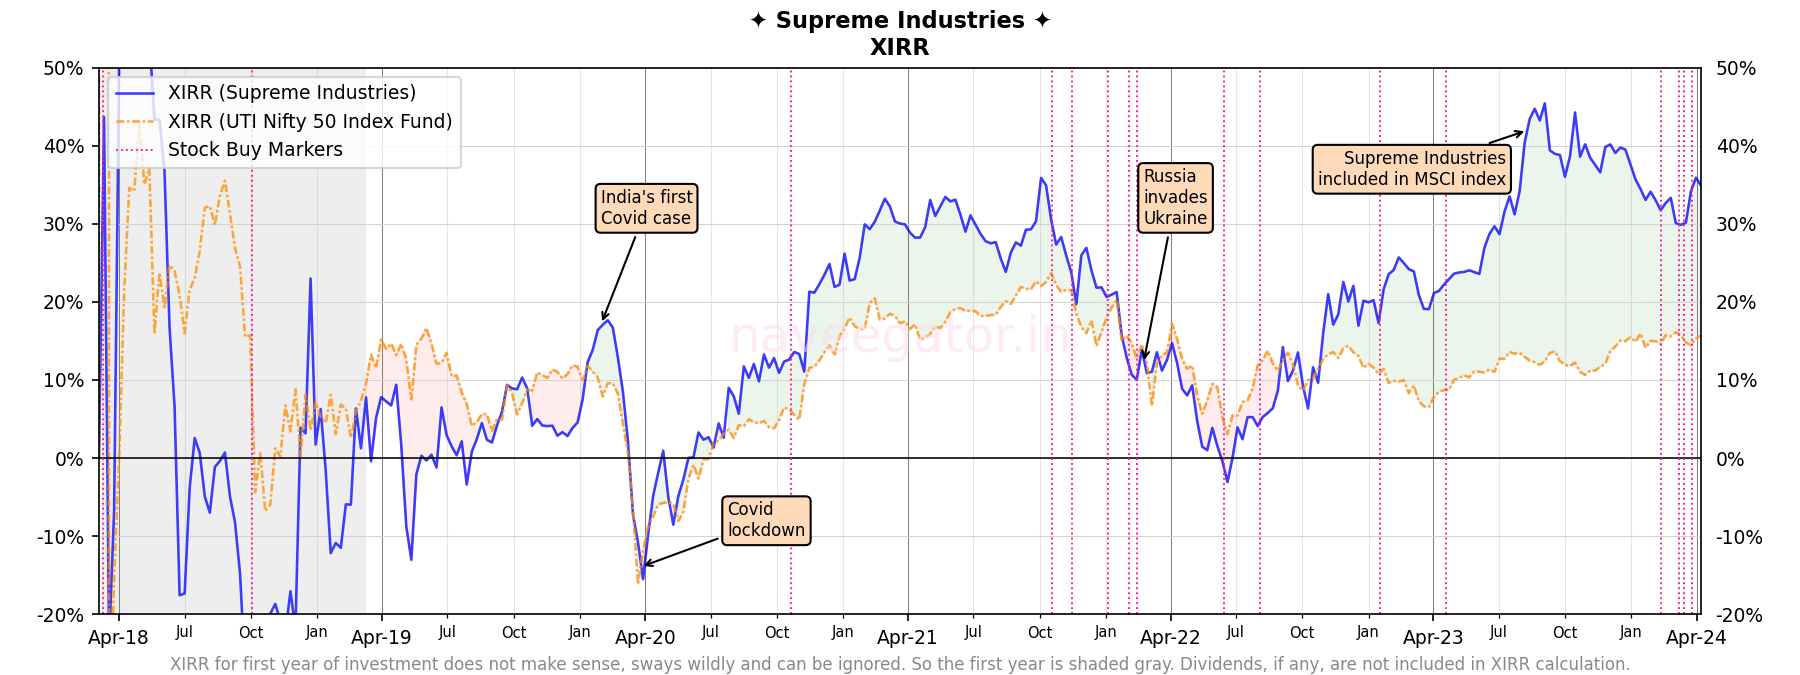
As the last fiscal year (2023-24) unfolded, Supreme Industries witnessed remarkable growth in its share price. Getting included in MSCI index also helped the growth. As a result at one point, my XIRR soared to an impressive 45%!
There was a minor correction, causing the stock price to dip below ₹4000. Undeterred by the temporary setback, I seized the opportunity to accumulate more shares, capitalizing on the lower price. Fast forward to the present—57% of my investment poured in during the last fiscal year (2023-24) alone! Interestingly, this situation mirrors the previous year where—at that time—three quarters of my investment came in last two fiscal years.
Investment through the years
Returns
A dividend yield at cost of 1% is… good enough.
Fiscal year
Dividend yield at cost
2018-19
0.75%
2019-20
2.14%
2020-21
0.42%
2021-22
0.65%
2022-23
1.13%
2023-24
1.02% *
* Data as of 9-Apr-2024
The dividend yield at cost mentioned in the Returns graph above, is yield at the date at which I received the dividends. Another way to look at dividend yield is to calculate it for the fiscal year. To calculate the dividend yield at cost in the above table I use the below formula. (Total amount of dividends received in a fiscal year ÷ Total amount invested at the end of fiscal year) × 100
Profit
XIRR
A remarkable 35% XIRR, compared to the Nifty 50 index’s 15%, is truly impressive! Now, the question remains: How long will it maintain this remarkable performance?


You must be logged in to post a comment.