From this Threads post, I learned today that Apple Reminders can be used as Kanban board.

Make sure you set Reminders to “View as Columns”. Add new section to add new column in that Kanban board.
Click here to view all the categories on naveegator.in
From this Threads post, I learned today that Apple Reminders can be used as Kanban board.
Make sure you set Reminders to “View as Columns”. Add new section to add new column in that Kanban board.
My thoughts from last year about my investment in Colgate.
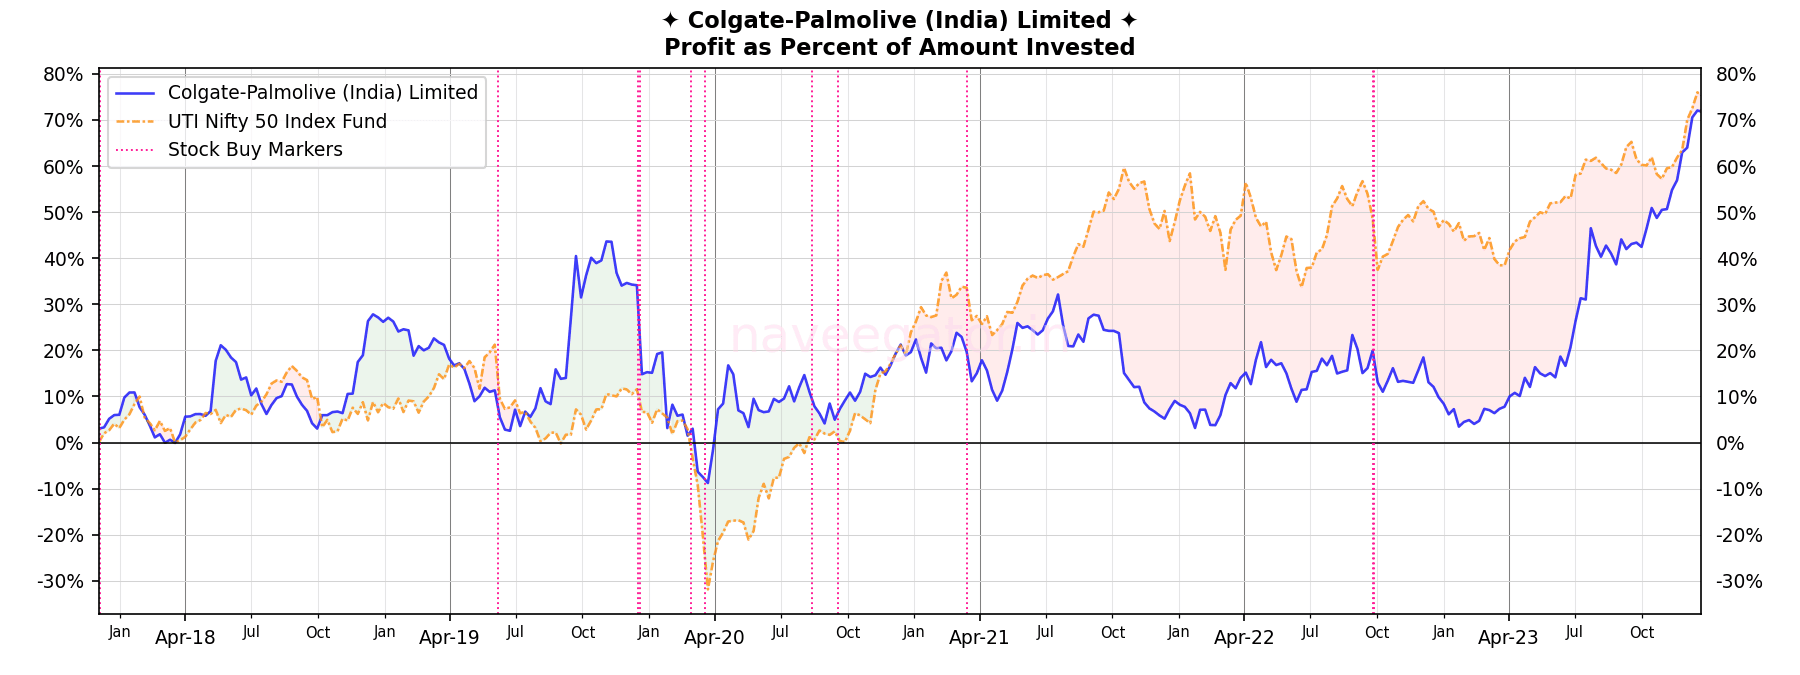
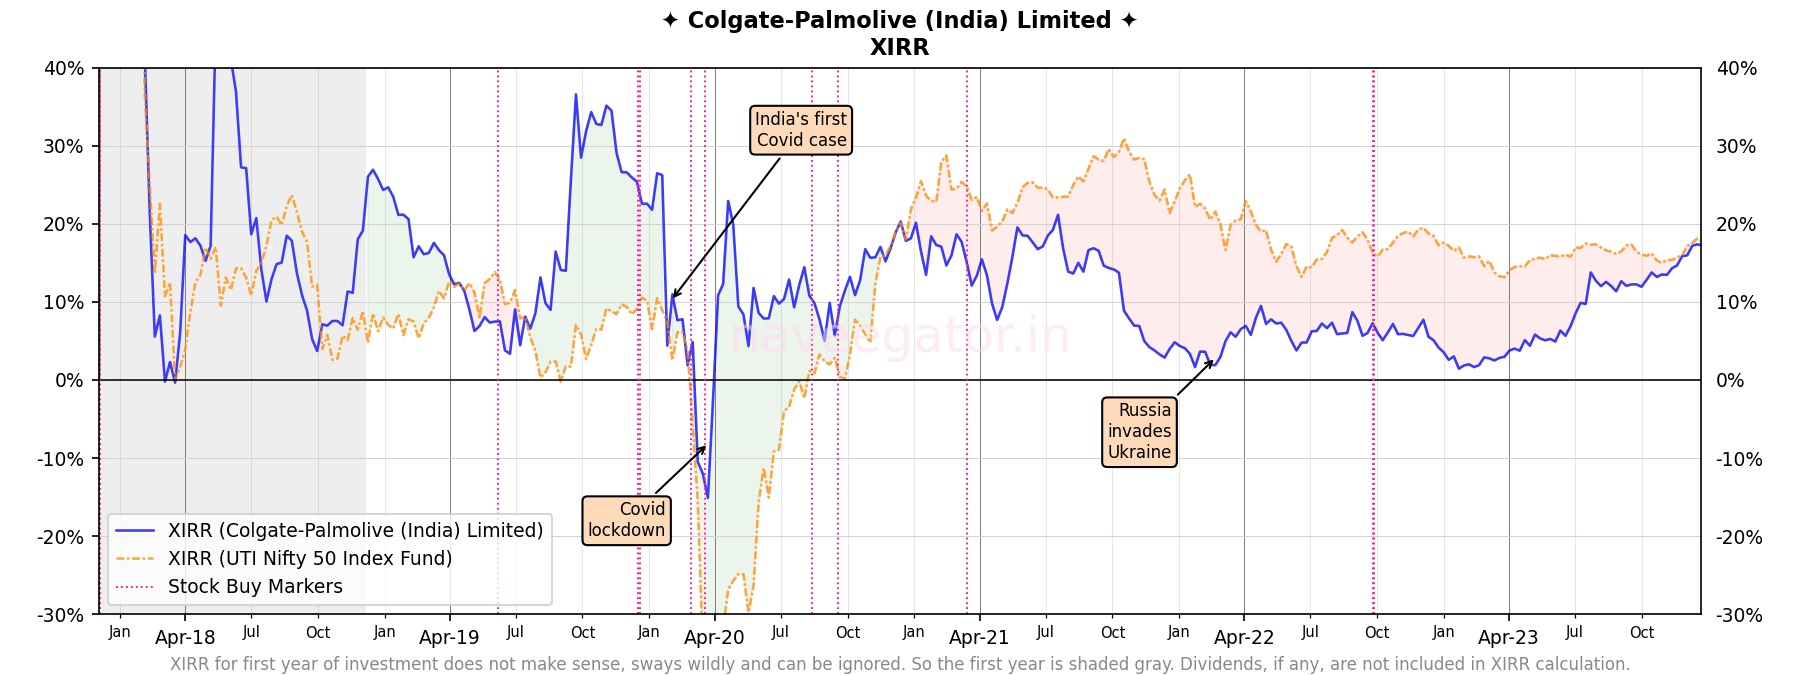
Continuing my investment in Colgate—which has been underperforming since 2 years—has been a very painful experience. I still have my conviction on this stock after five years, albeit it is now on shaky ground.
My conviction has paid off this year. From the beginning of the year, Colgate has experienced a steady upward trend, with a remarkable increase of over 65%. Following three years of lagging behind the Nifty 50 Index, my investment in Colgate has now successfully bridged the gap. Given the current momentum, I am confident that it will outperform the Nifty 50 Index in the coming year. Additionally, the dividends have proven to be satisfactory.
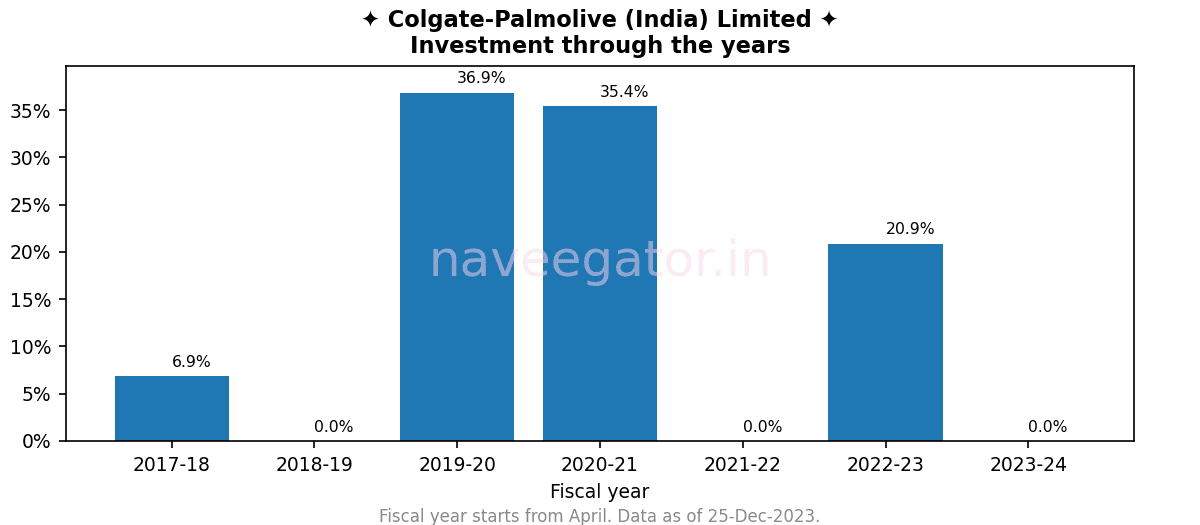
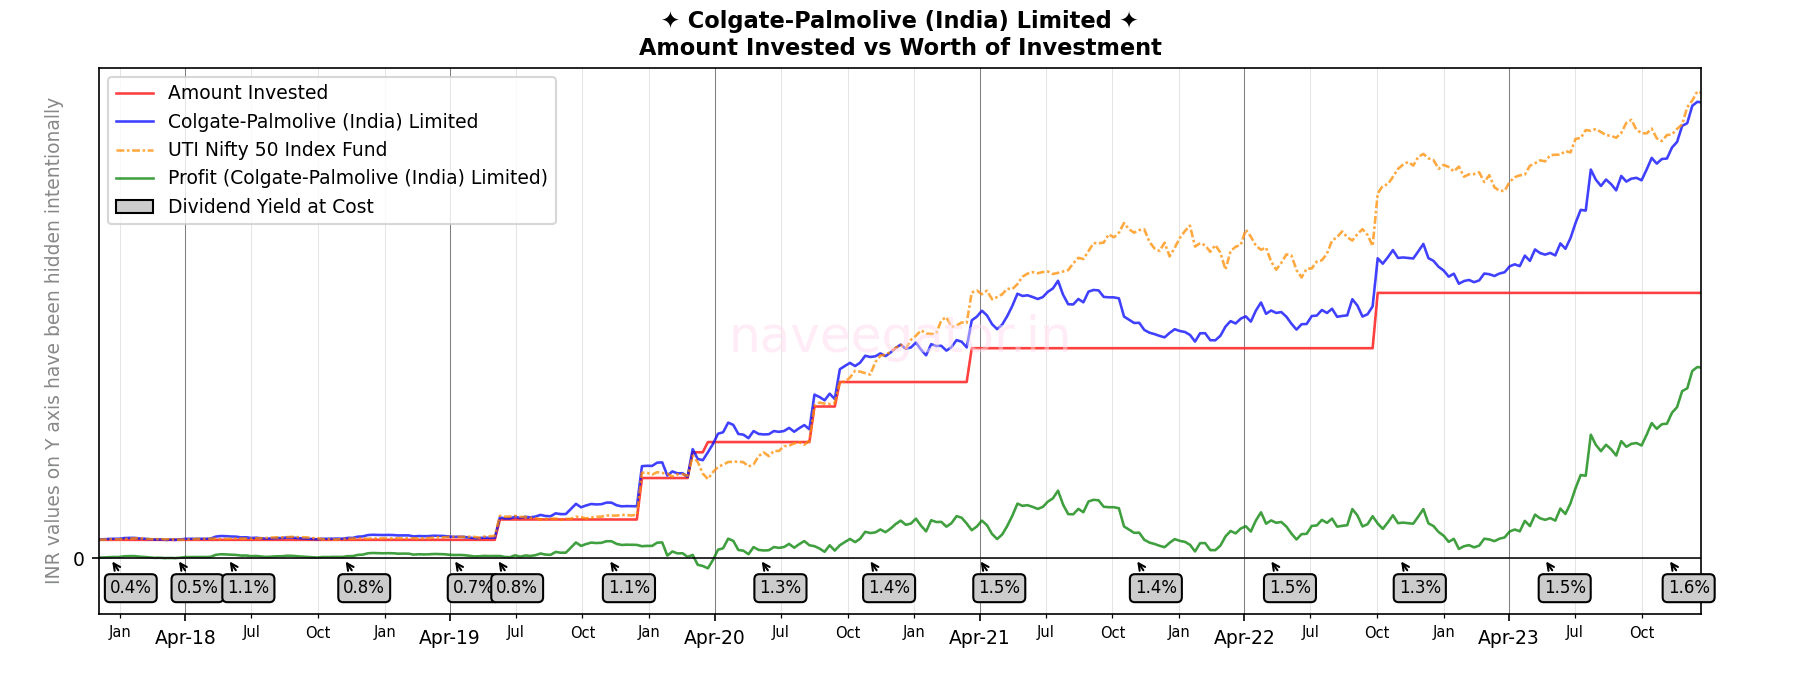
The dividend yield at cost mentioned in the chart above, is yield at the date at which I received the dividends. Another way to look at dividend yield is to calculate it for the fiscal year.
| Fiscal year | Dividend yield at cost |
| 2017-18 | 0.87% |
| 2018-19 | 1.83% |
| 2019-20 | 0.59% |
| 2020-21 | 3.31% |
| 2021-22 | 1.40% |
| 2022-23 | 2.51% |
| 2023-24 | 3.07% * |
To calculate the dividend yield at cost in the above table I use the below formula.
(Total amount of dividends received in a fiscal year ÷ Total amount invested at the end of fiscal year) × 100
Related reading
Note: I missed including some of my Colgate-Palmolive (India) Limited share purchases in previous articles. These are rectified in this post, so there will be difference between my previous analysis and this one.
Six years ago I subscribed to the HDFC Life Insurance IPO. And I got lucky! HDFC Life Insurance opened up with a nice 17% gain on first day. I sat on my luck for few years not investing much agin. It was only in the FY 2021-22 and 2022-23 that I significantly increased my allocation. In fact 88% of my investment in HDFC Life Insurance has come in last two and half years, so my investment is still very young.
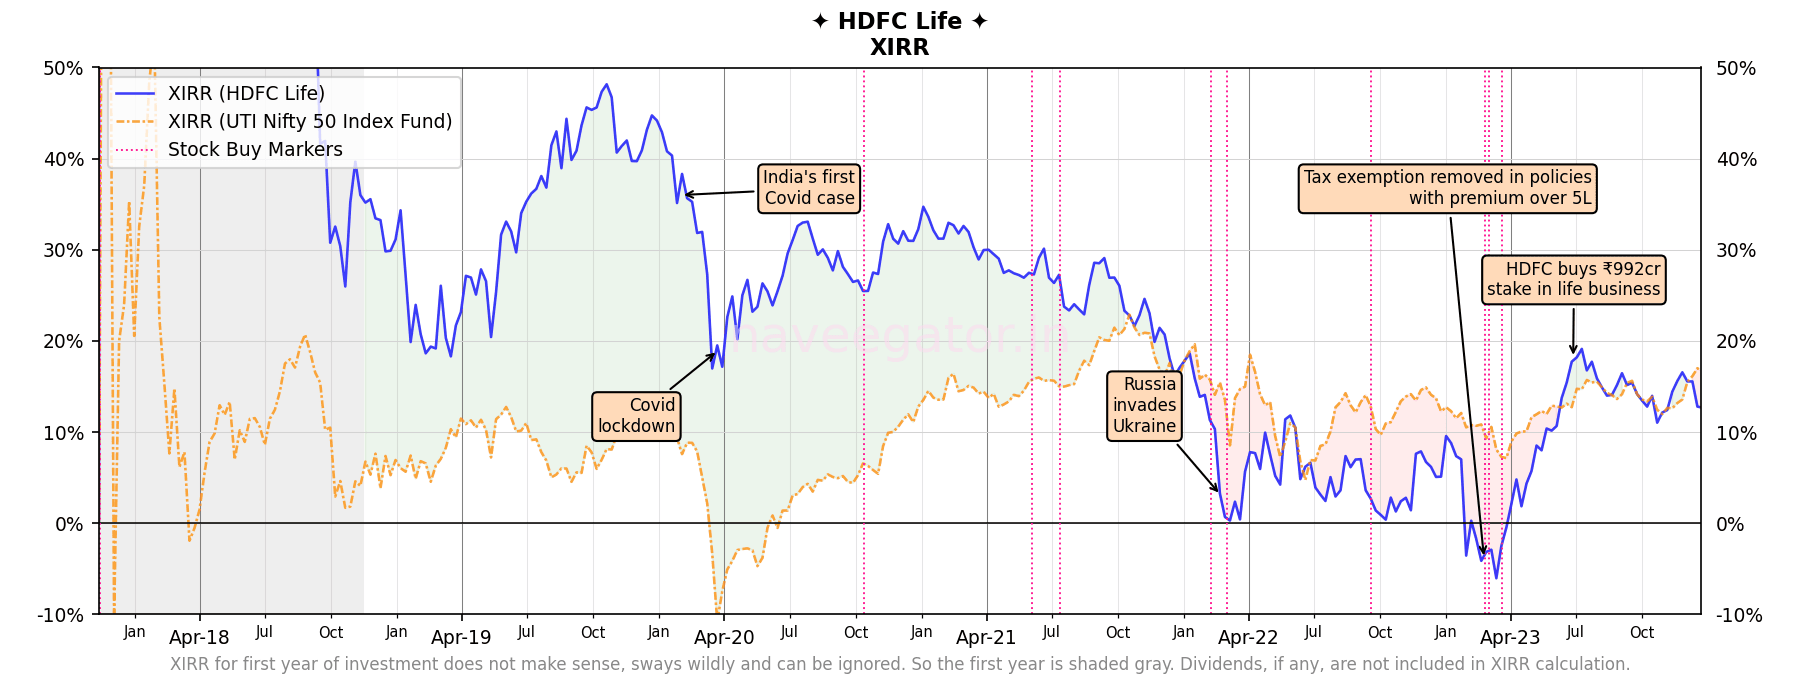
This was a significant announcement in the Budget 2023.
Income from traditional insurance policies where the premium is over Rs 5 lakh will no more be exempt from taxes, Finance Minister Nirmala Sitharaman announced in her Budget speech.
Budget 2023: Tax exemption removed in insurance policies with premium over Rs 5 lakh
And this change would impact profitability of almost all the life insurance products.
The changes to tax exemption on life insurance policies announced by Finance Minister Nirmala Sitharaman in her 2023 Budget speech on February 1 are likely to have a 10-12 percent impact on the topline products of HDFC Life and a 5 percent impact on the bottomline products if nothing is done to mitigate the change, predicts Vibha Padalkar, MD and CEO of HDFC Life Insurance.
Budget 2023: Tax tweak in life insurance to dent topline 10-12%, says HDFC Life chief
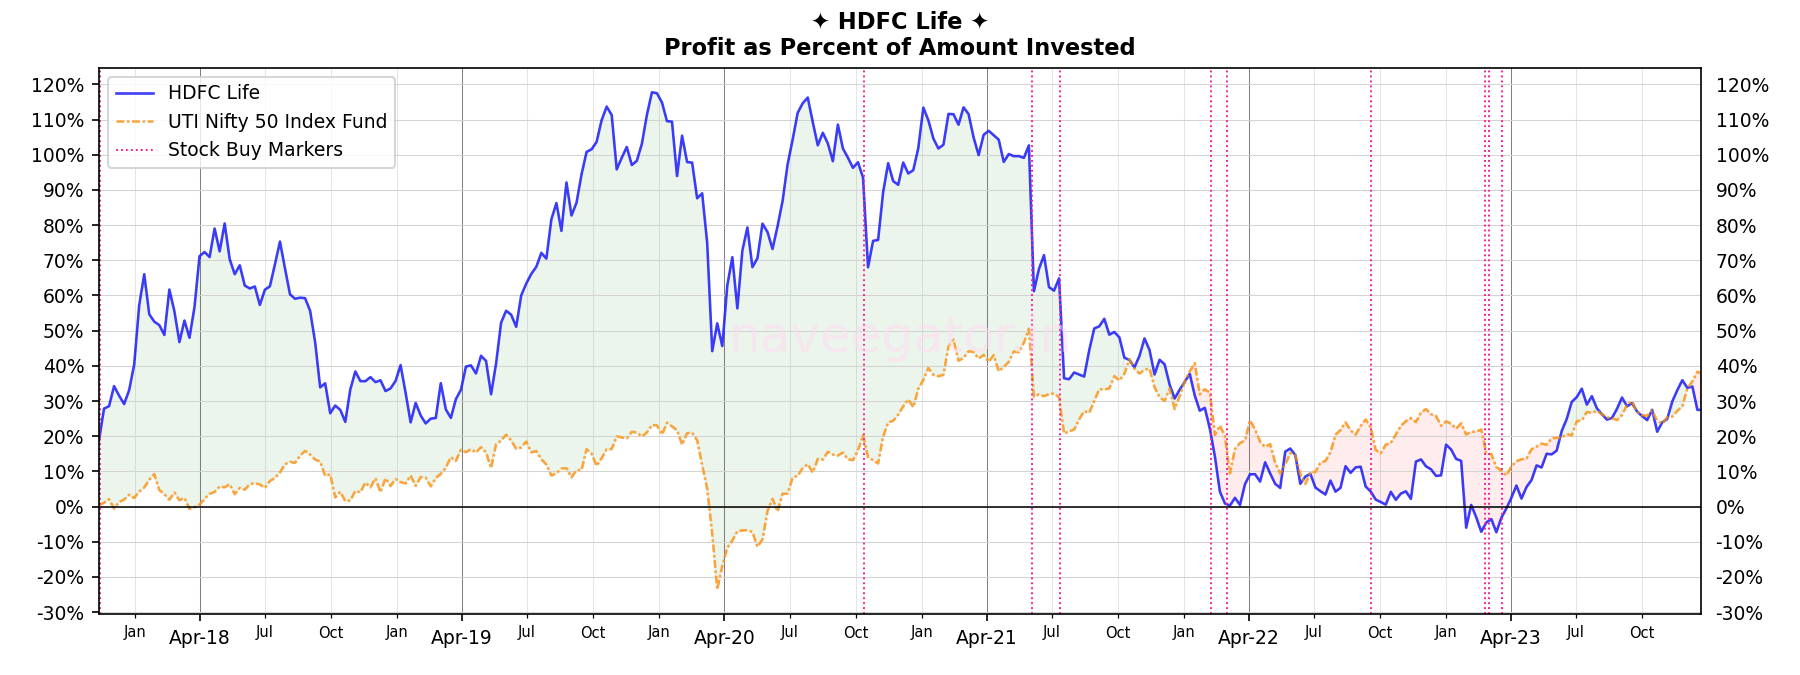
And with that announcement my returns—for the first time in 5 years—became negative. I used that opportunity to invest more. In the hindsight—I think—it was a good decision. The share price has recovered and I am at 12% XIRR. Although I am still underperforming Nifty 50 Index where I would have made 16%.

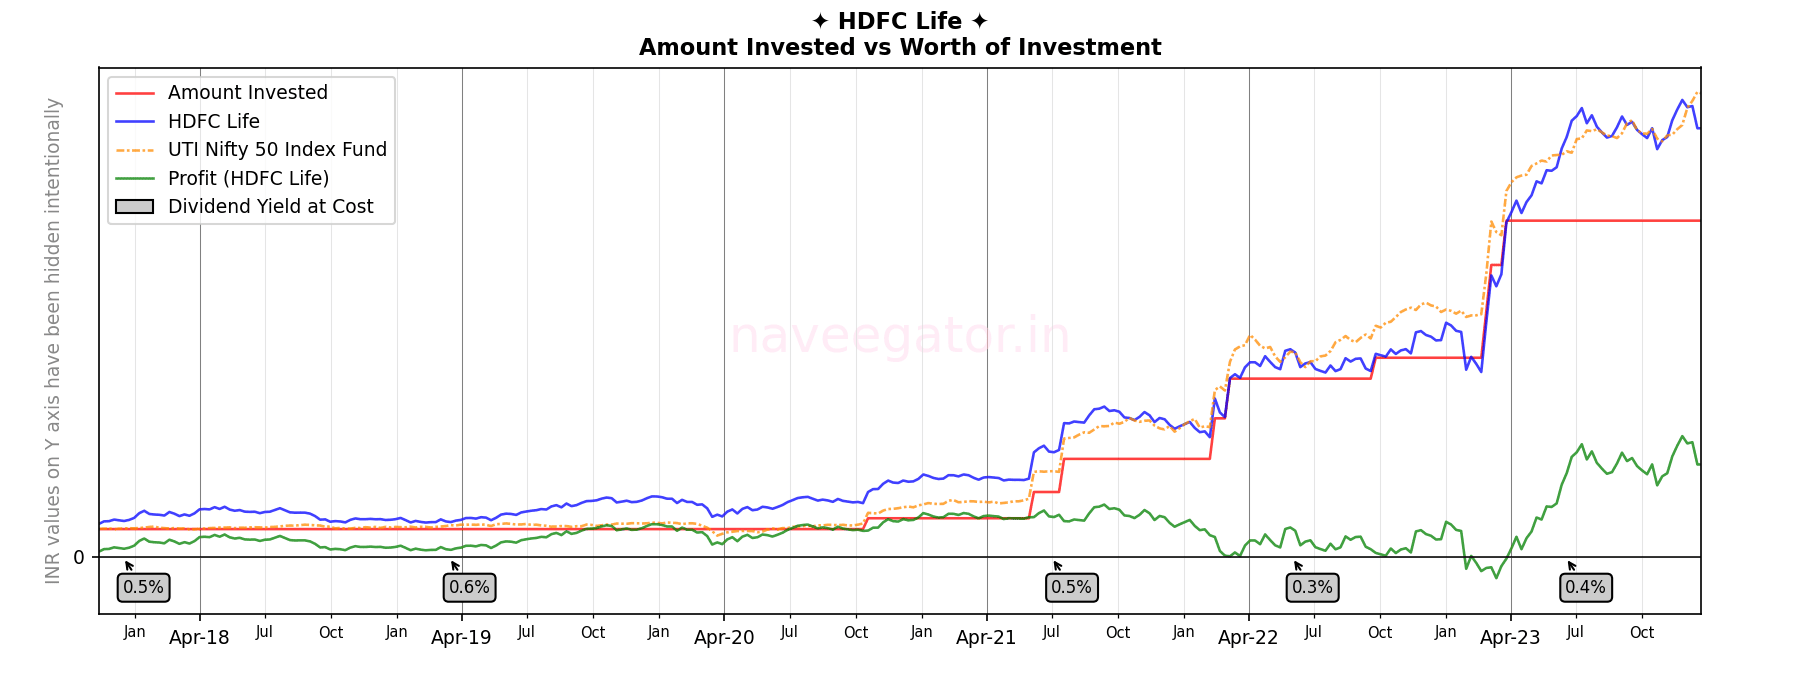
The dividend yield at cost mentioned in the chart above, is yield at the date at which I received the dividends. Another way to look at dividend yield is to calculate it for the fiscal year.
| Fiscal year | Dividend yield at cost |
| 2017-18 | 0.47% |
| 2018-19 | 0.57% |
| 2019-20 | 0.00% |
| 2020-21 | 0.00% |
| 2021-22 | 0.17% |
| 2022-23 | 0.17% |
| 2023-24 | 0.38% * |
To calculate the dividend yield at cost in the above table I use the below formula.
(Total amount of dividends received in a fiscal year ÷ Total amount invested at the end of fiscal year) × 100
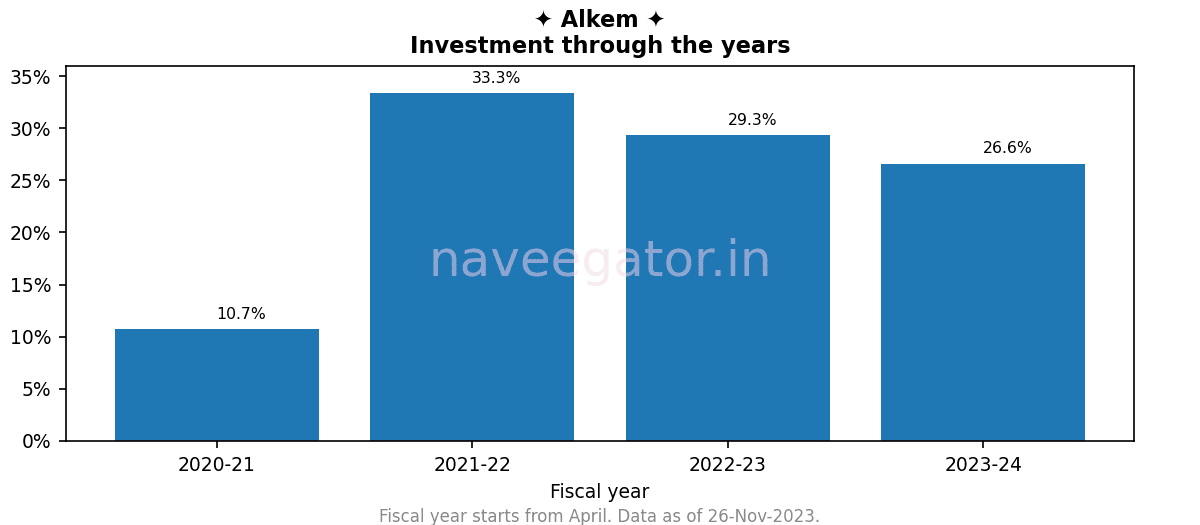
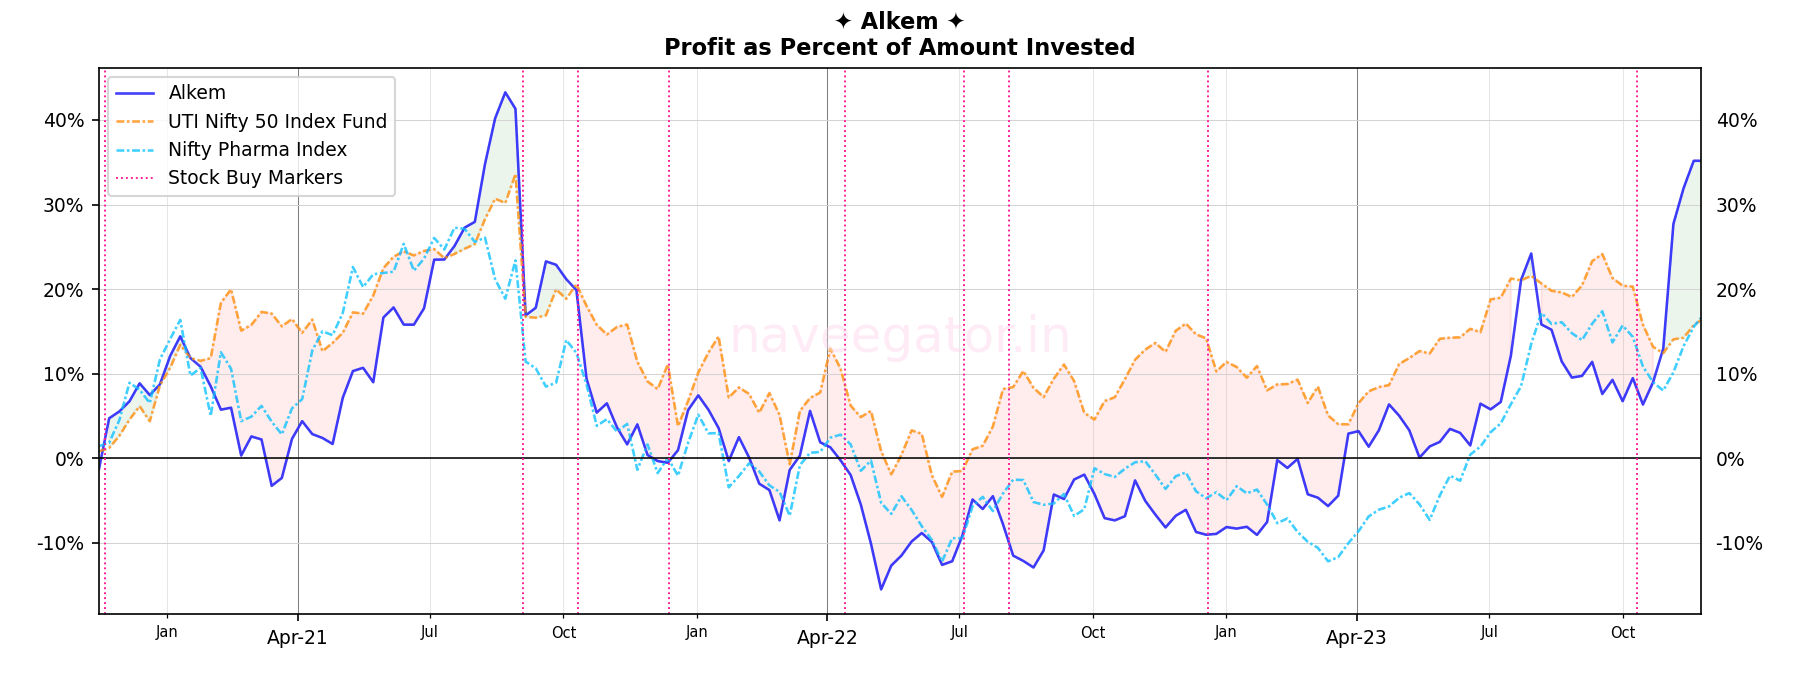
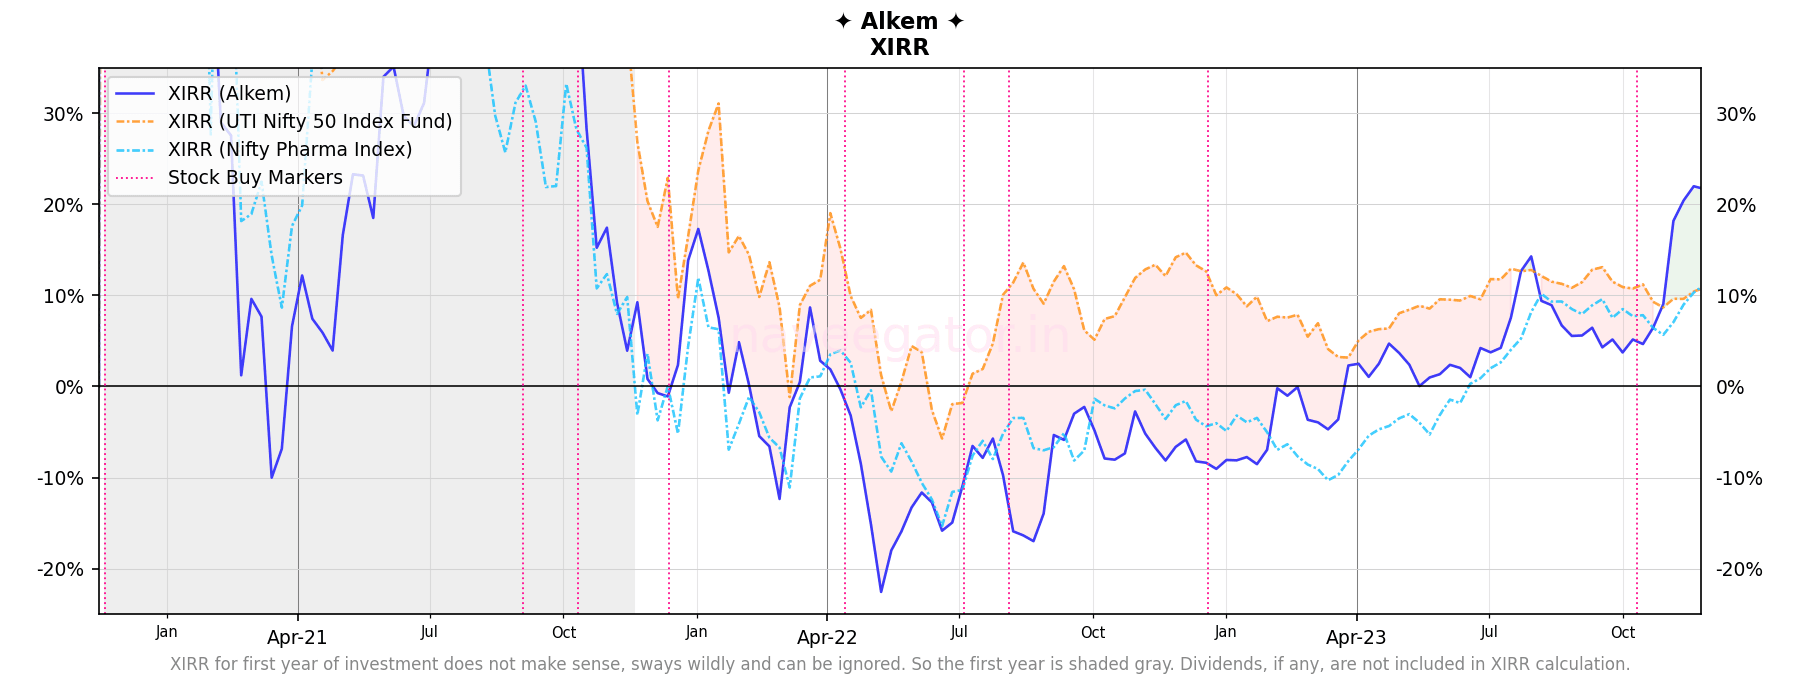
Three years ago, I made the decision to invest in Alkem solely based on its inclusion in the Nifty Next 50 index. Without conducting any further research or analysis, I relied on the belief that companies included in Nifty Next 50 index are generally considered to be well-established and stable. What I didn’t consider was that Alkem can also be removed from the Nifty Next 50 index.
Alkem is now no longer part of Nifty Next 50 index and its underperformance vis-a-vis Nifty 50 index since last two years had made my palms sweaty. But there has been a very recent uptick in the share price where it has gone up by almost 25% in last one month. While I would have made 10% XIRR with Nifty 50 Index I am now at 22% XIRR with Alkem. Let’s see how long the party lasts.
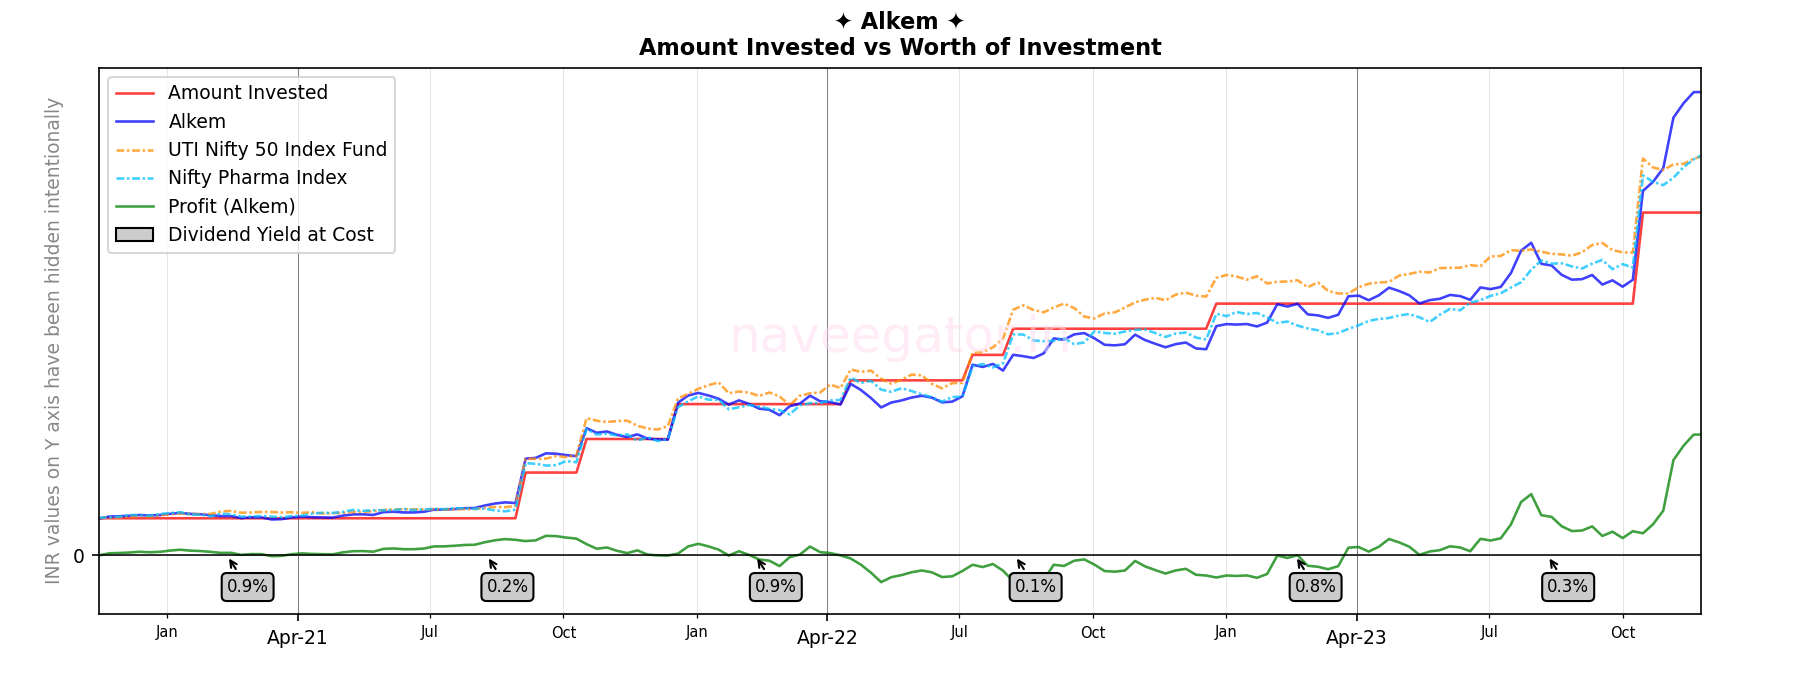
The dividend yield at cost mentioned in the chart above, is yield at the date at which I received the dividends. Another way to look at dividend yield is to calculate it for the fiscal year.
| Fiscal year | Dividend yield at cost |
| 2020-21 | 0.92% |
| 2021-22 | 0.92% |
| 2022-23 | 0.87% |
| 2023-24 | 0.22% * |
To calculate the dividend yield at cost in the above table I use the below formula.
(Total amount of dividends received in a fiscal year ÷ Total amount invested at the end of fiscal year) × 100
A wonderful anecdote on how Windows 95 timezone map created chaos!
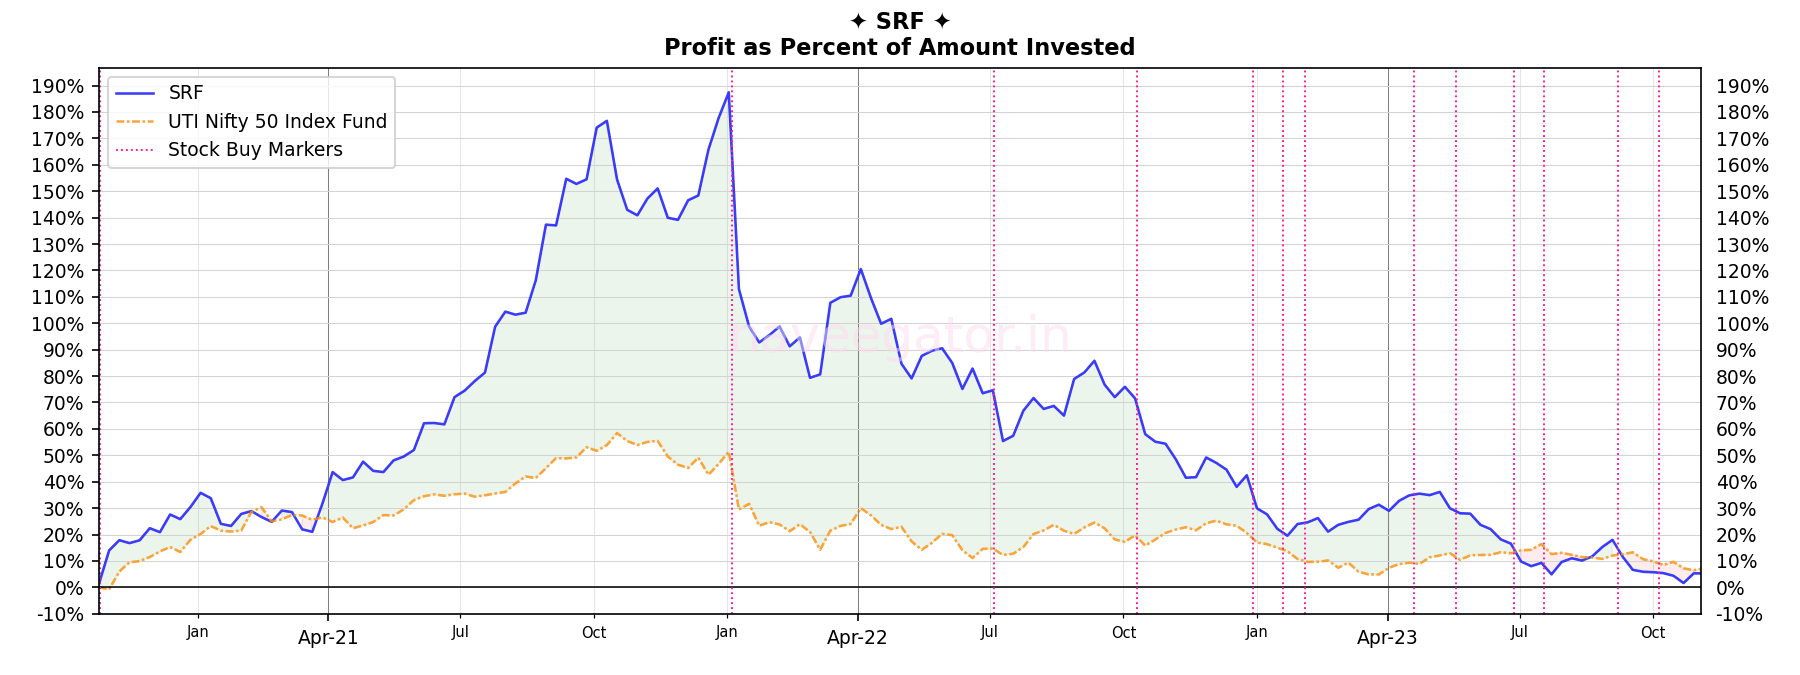
I started invest in SRF three years back, but it is only in this fiscal year that I have significantly increased my investment in SRF. This fiscal year alone I have invested more than 65% of my total investment. This makes my investment very young.

During the initial days my investment in SRF was comfortably beating Nifty 50 Index. But as I decided to increase my investment and SRF’s share price going sideways, I am now barely beating Nifty 50 Index. SRF generally announces dividends twice a year, but nothing to be talked about.
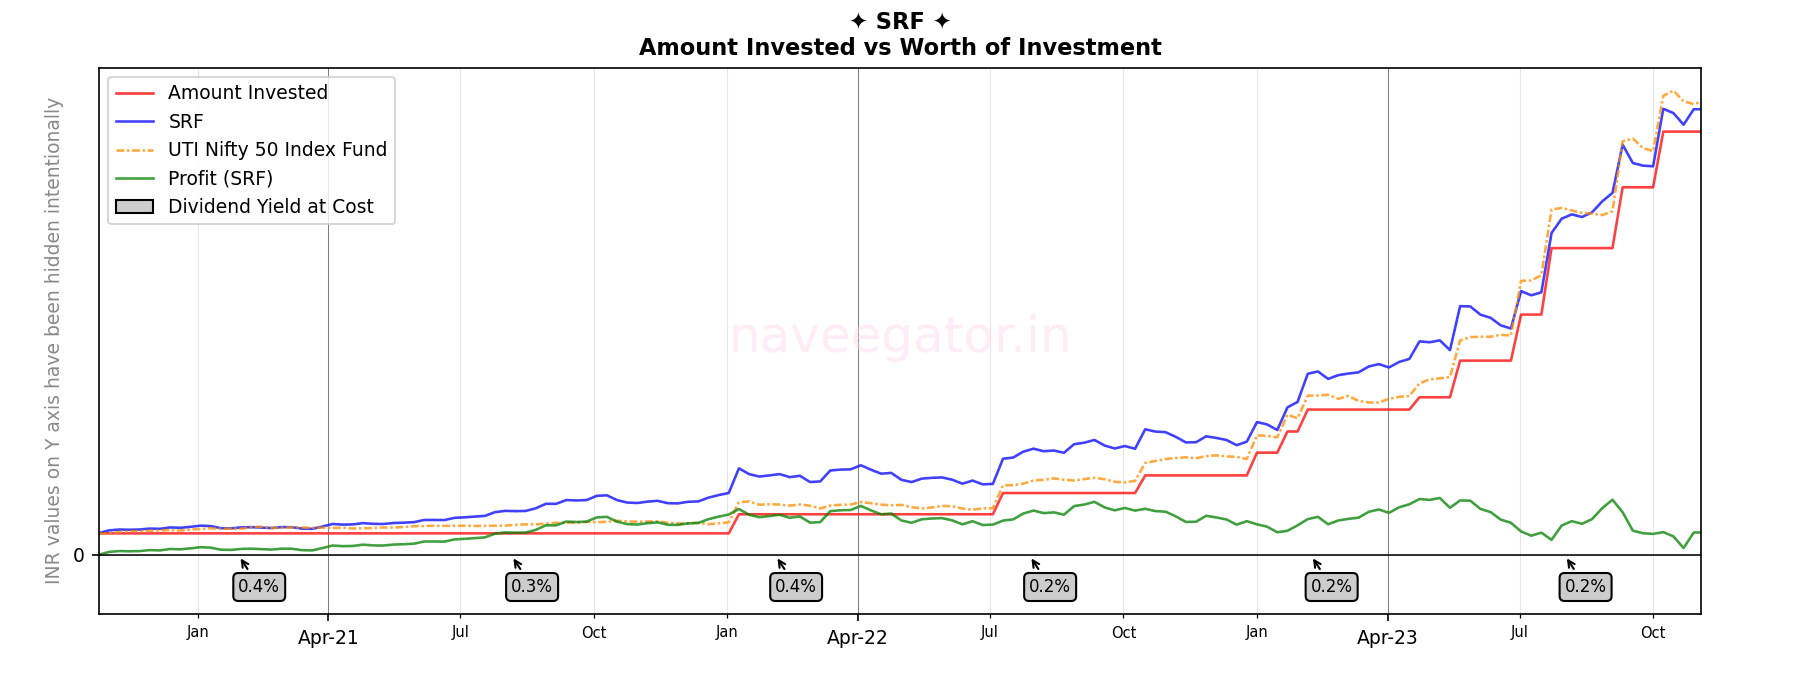
The dividend yield at cost mentioned in the chart above, is yield at the date at which I received the dividends. Another way to look at dividend yield is to calculate it for the fiscal year.
| Fiscal year | Dividend yield at cost |
| 2020-21 | 0.44% |
| 2021-22 | 0.53% |
| 2022-23 | 0.30% |
| 2023-24 | 0.13% * |
To calculate the dividend yield at cost in the above table I use the below formula.
(Total amount of dividends received in a fiscal year ÷ Total amount invested at the end of fiscal year) × 100
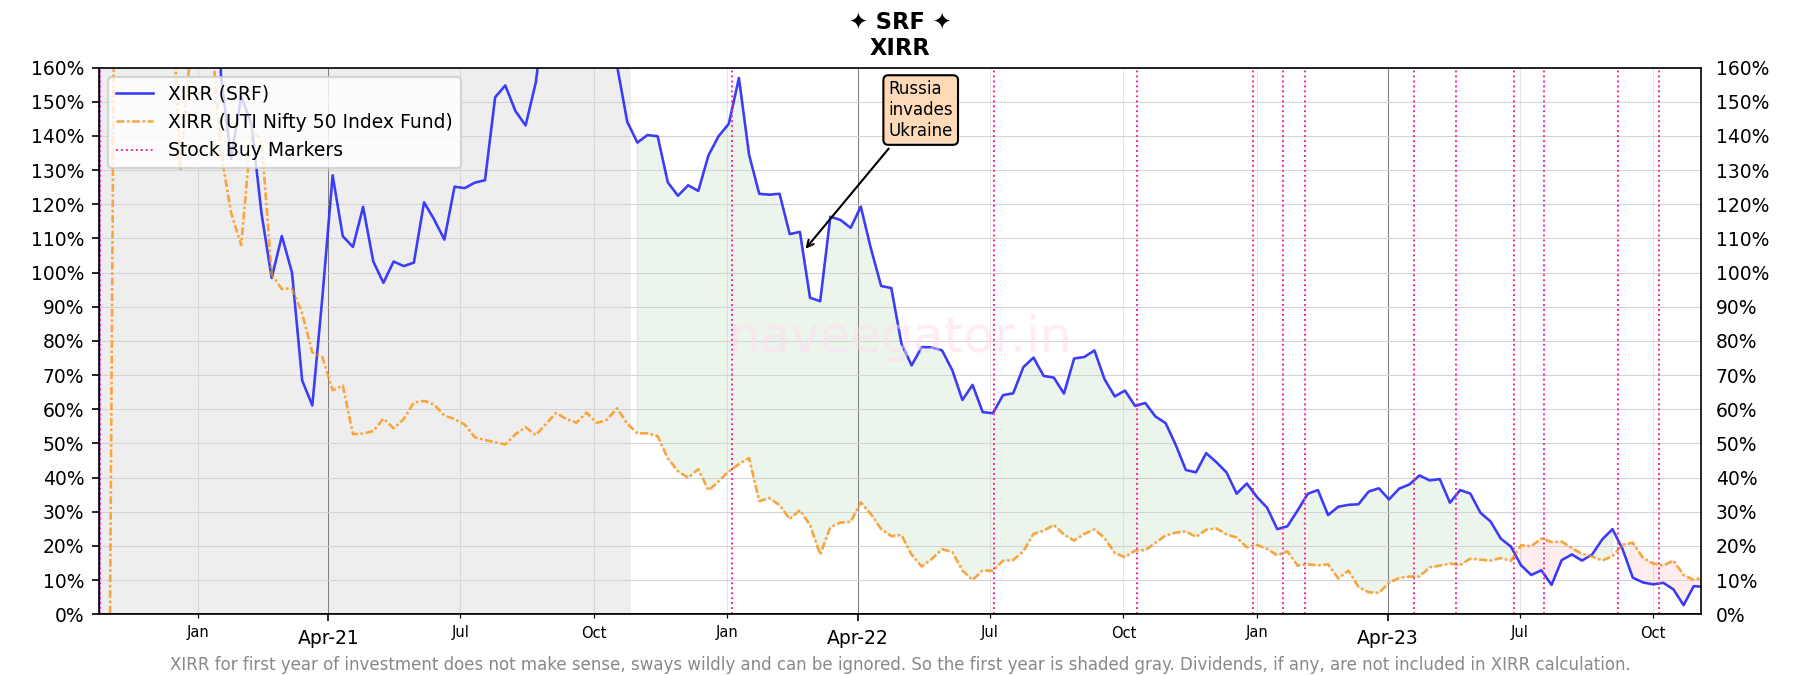
At XIRR of 8%, I am underperforming Nifty 50 Index which would have been at 11%.
A wonderful analysis on long term investing across 15-year period starting 1995. Below is my favourite paragraph. Why? It emphasises how uncertain long term equity returns are.
Imagine being the investor who started in 1995. Seeing your portfolio exceed 1 Cr (₹ 10 Million) in January 2008, 14 years into your investing journey, only to see it plummet 60% to 40L (₹ 4 Million) late in 2008 before finally coming back to 89L (₹ 8.9 Million) by the end of 2009.
The 12% Myth: Estimating Long-Term Equity Returns
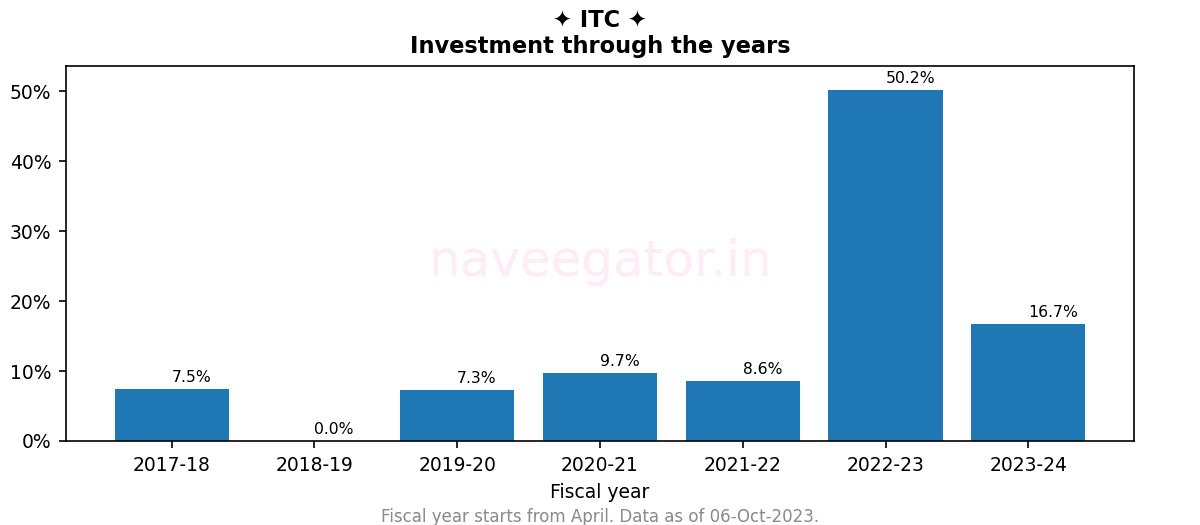
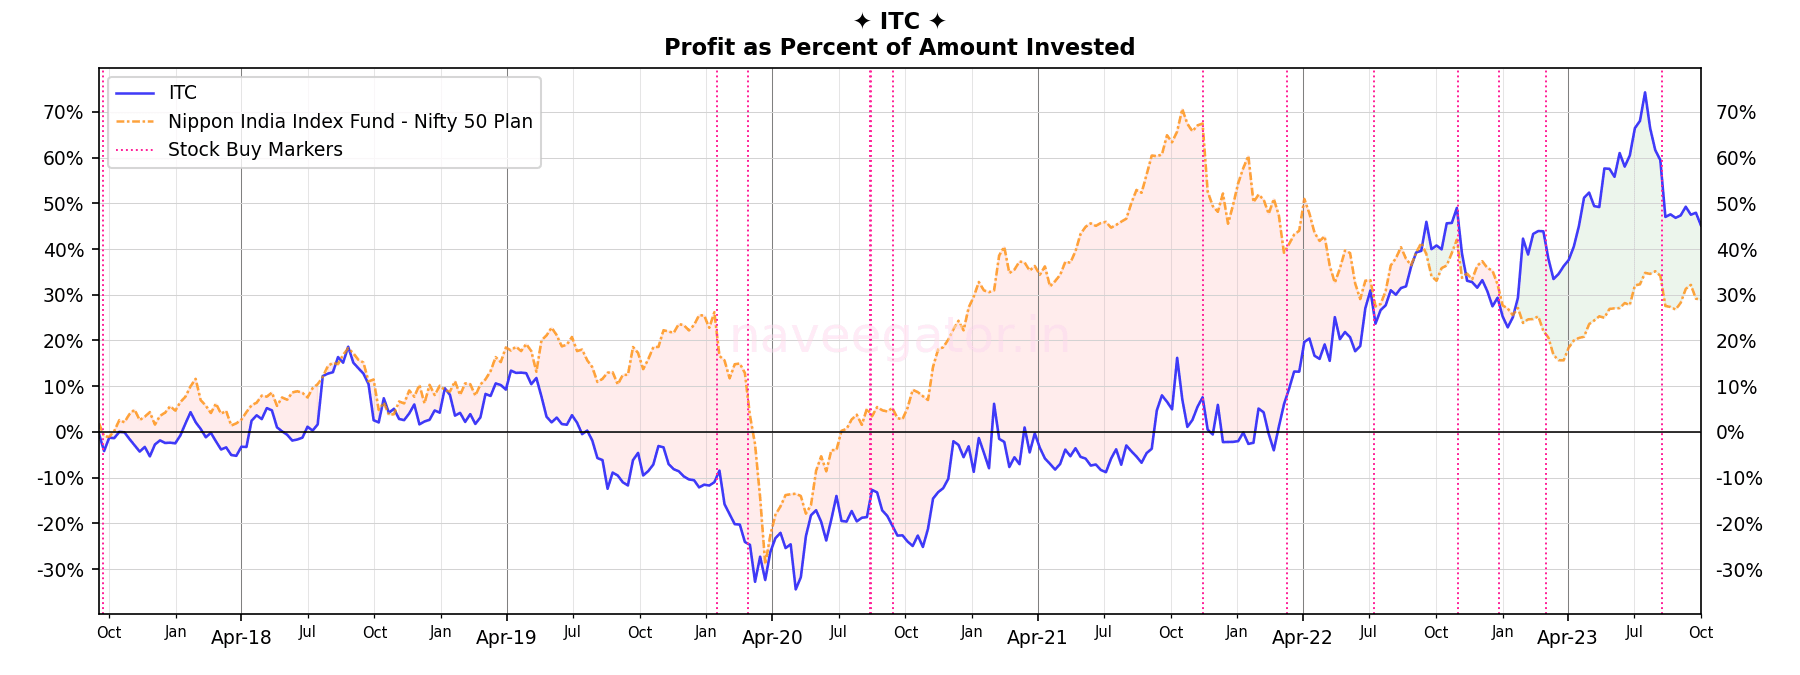
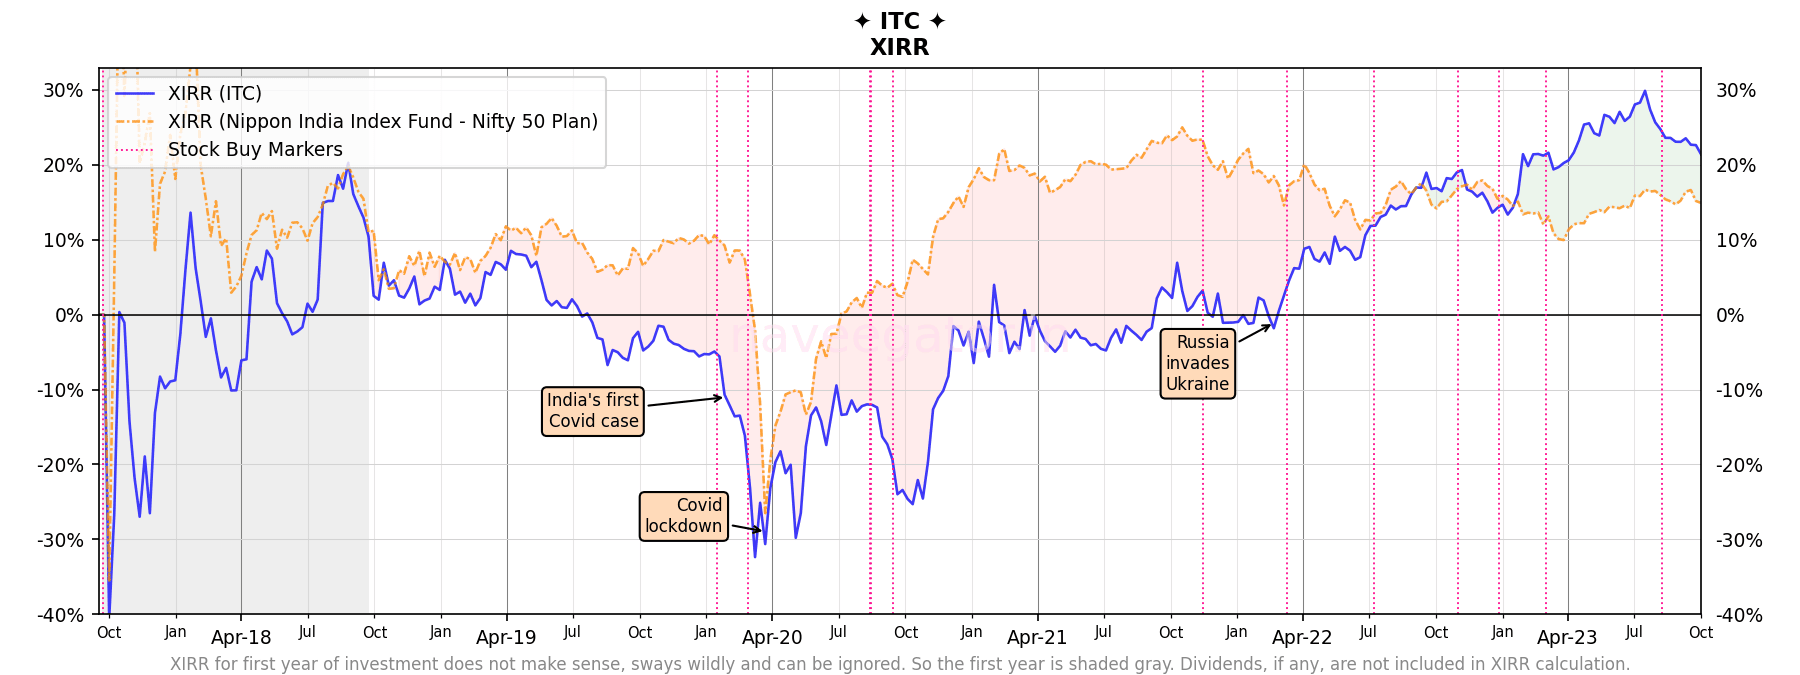
After severely underperforming Nifty 50 Index for five years, my investment in ITC is not only in profit but also beating Nifty 50 Index. What a turnaround! I had only heard about such things, over the past year I have witnessed it. Over last fiscal year I have significantly increased investment in ITC, so much so that over 66% of my investments b v has come in last 1.5 years.

The dividend yield at cost mentioned in the chart above, is yield at the date at which I received the dividends. Another way to look at dividend yield is to calculate it for the fiscal year.
| Fiscal year | Dividend yield at cost |
| 2018-19 | 1.91% |
| 2019-20 | 1.08% |
| 2020-21 | 4.81% |
| 2021-22 | 3.93% |
| 2022-23 | 2.98% |
| 2023-24 | 2.81% * |
To calculate the dividend yield at cost in the above table I use the below formula.
(Total amount of dividends received in a fiscal year ÷ Total amount invested at the end of fiscal year) × 100
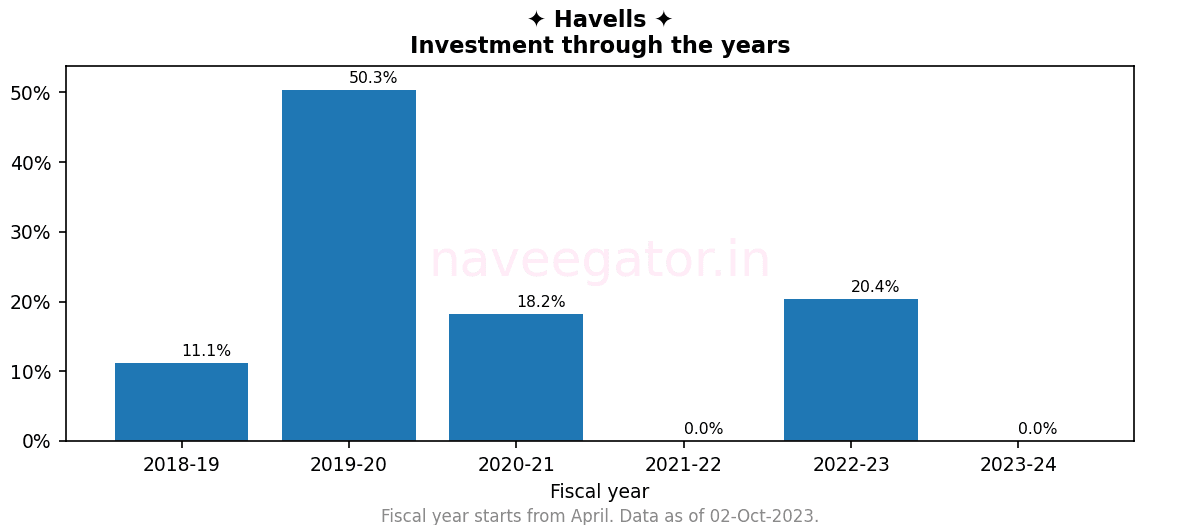
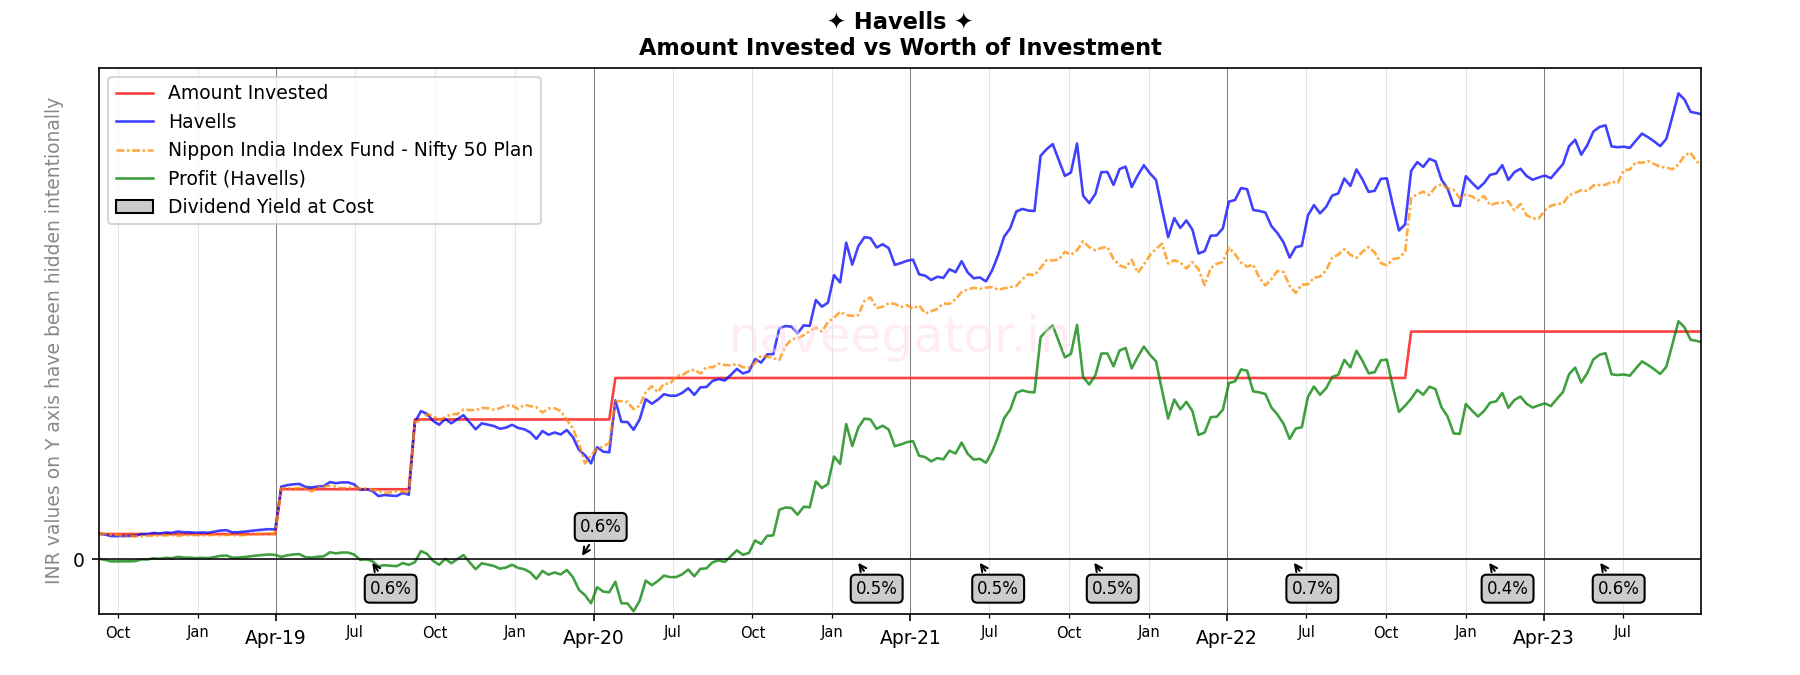
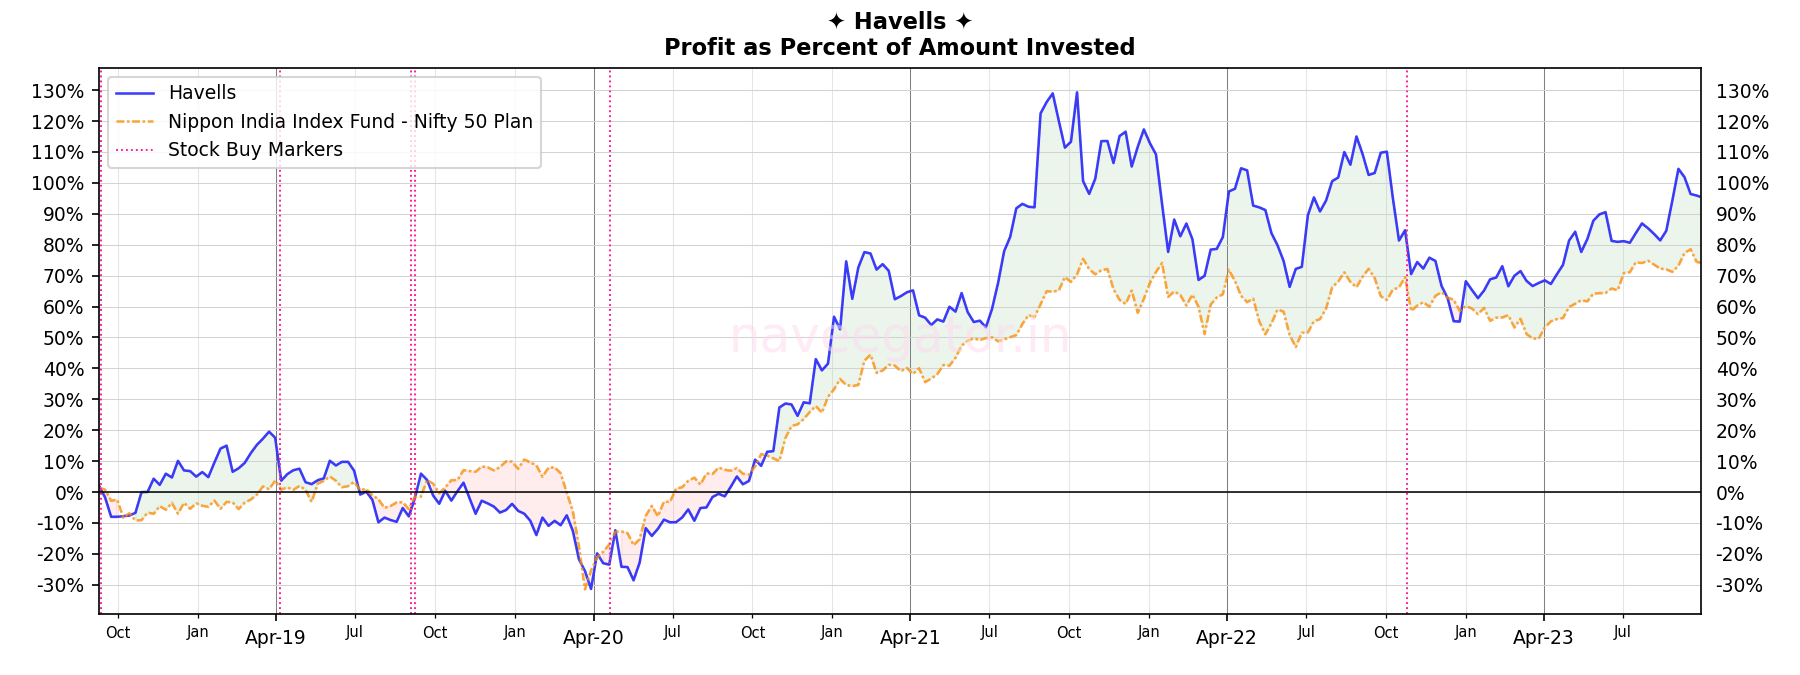
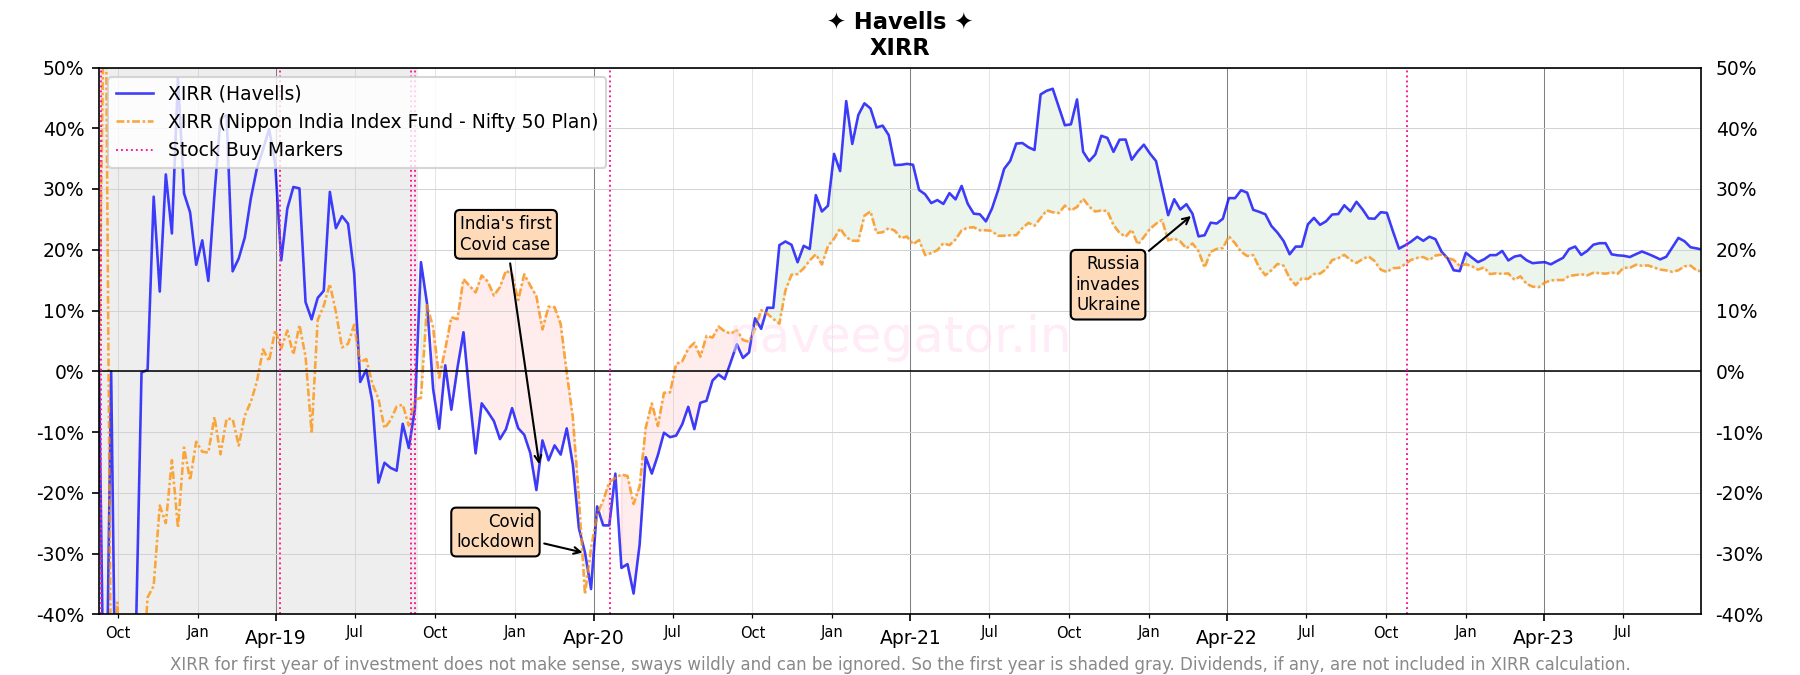
Note: I missed including some of my Havells share purchases in previous articles. These are rectified in this post, so there will be difference between my previous analysis and this one.
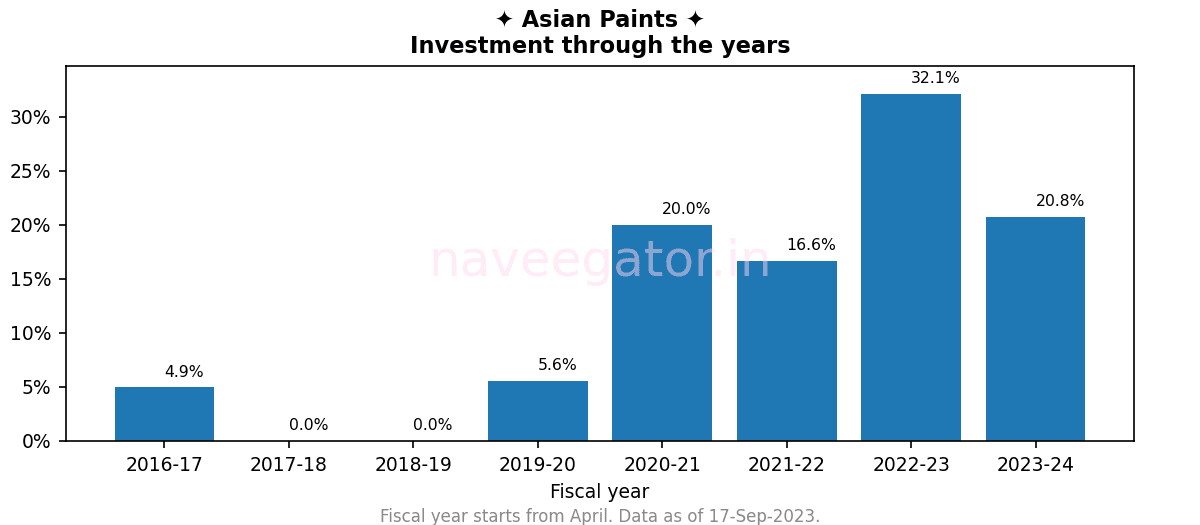
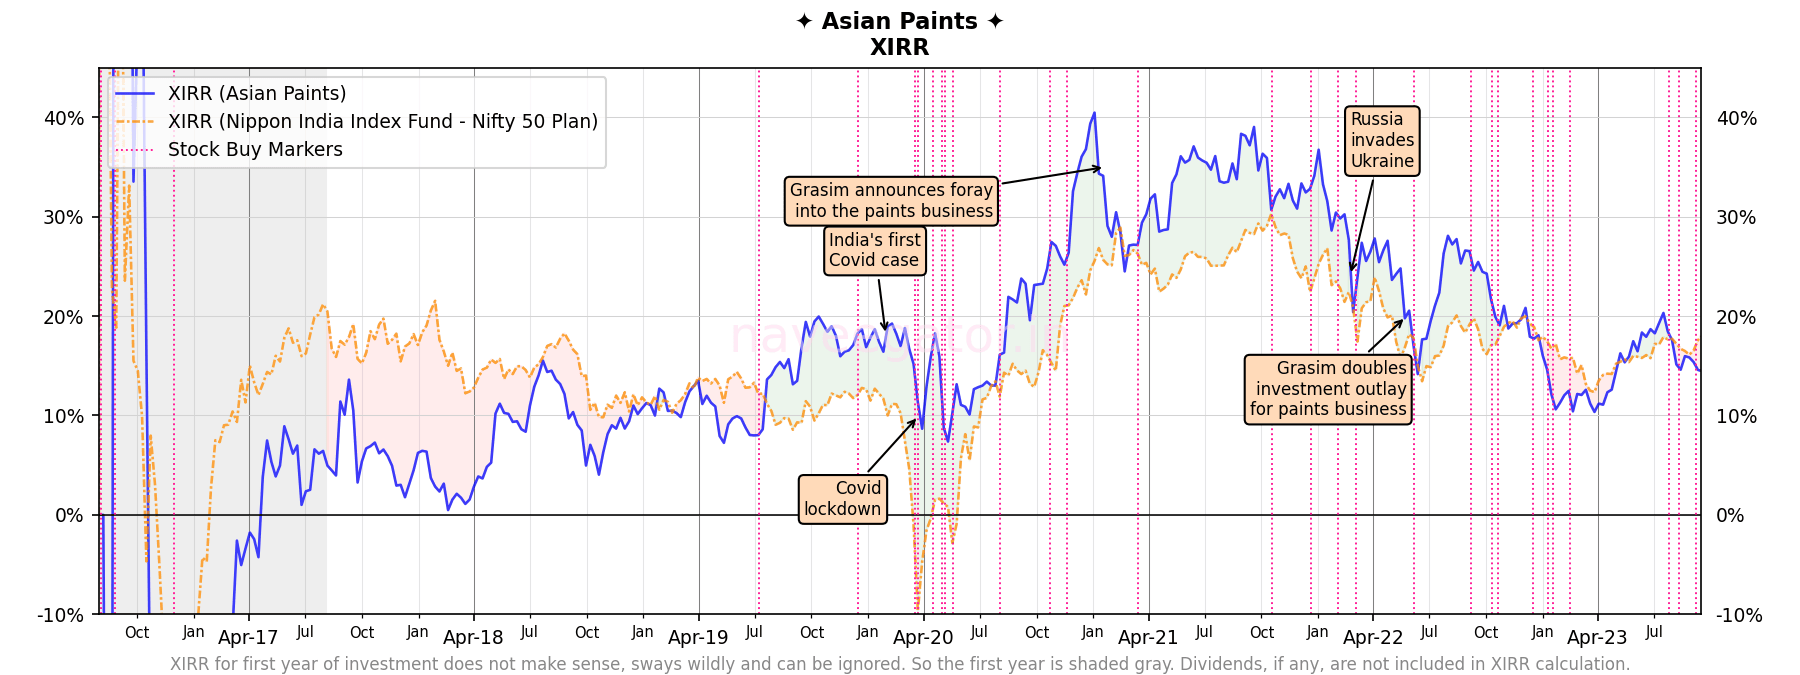
Seven years as shareholder of Asian Paints but with 90% of that investment coming in last four years, my analysis should be taken with a pinch of salt.
The foolish decision of not investing anything during FY 2017-18 and FY 2018-19 still haunts me.
The dividends continue to be, meh!
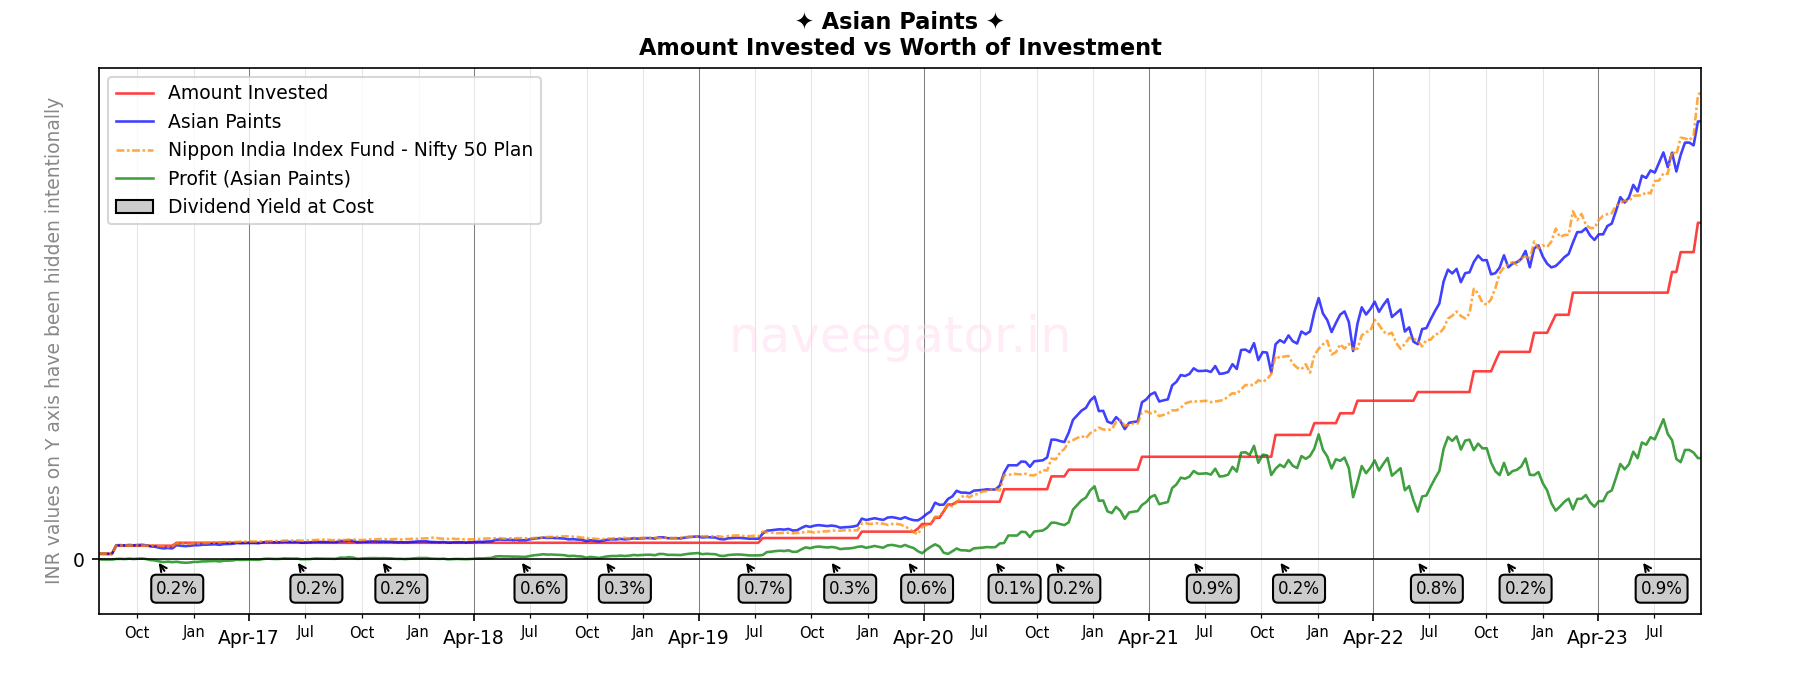
The dividend yield at cost mentioned in the chart above, is yield at the date at which I received the dividends. Another way to look at dividend yield is to calculate it for the fiscal year.
| Fiscal year | Dividend yield at cost |
| 2016-17 | 0.19% |
| 2017-18 | 0.70% |
| 2018-19 | 0.81% |
| 2019-20 | 0.96% |
| 2020-21 | 0.24% |
| 2021-22 | 0.73% |
| 2022-23 | 0.64% |
| 2023-24 | 0.73% * |
To calculate the dividend yield at cost in the above table I use the below formula.
(Total amount of dividends received in a fiscal year ÷ Total amount invested at the end of fiscal year) × 100
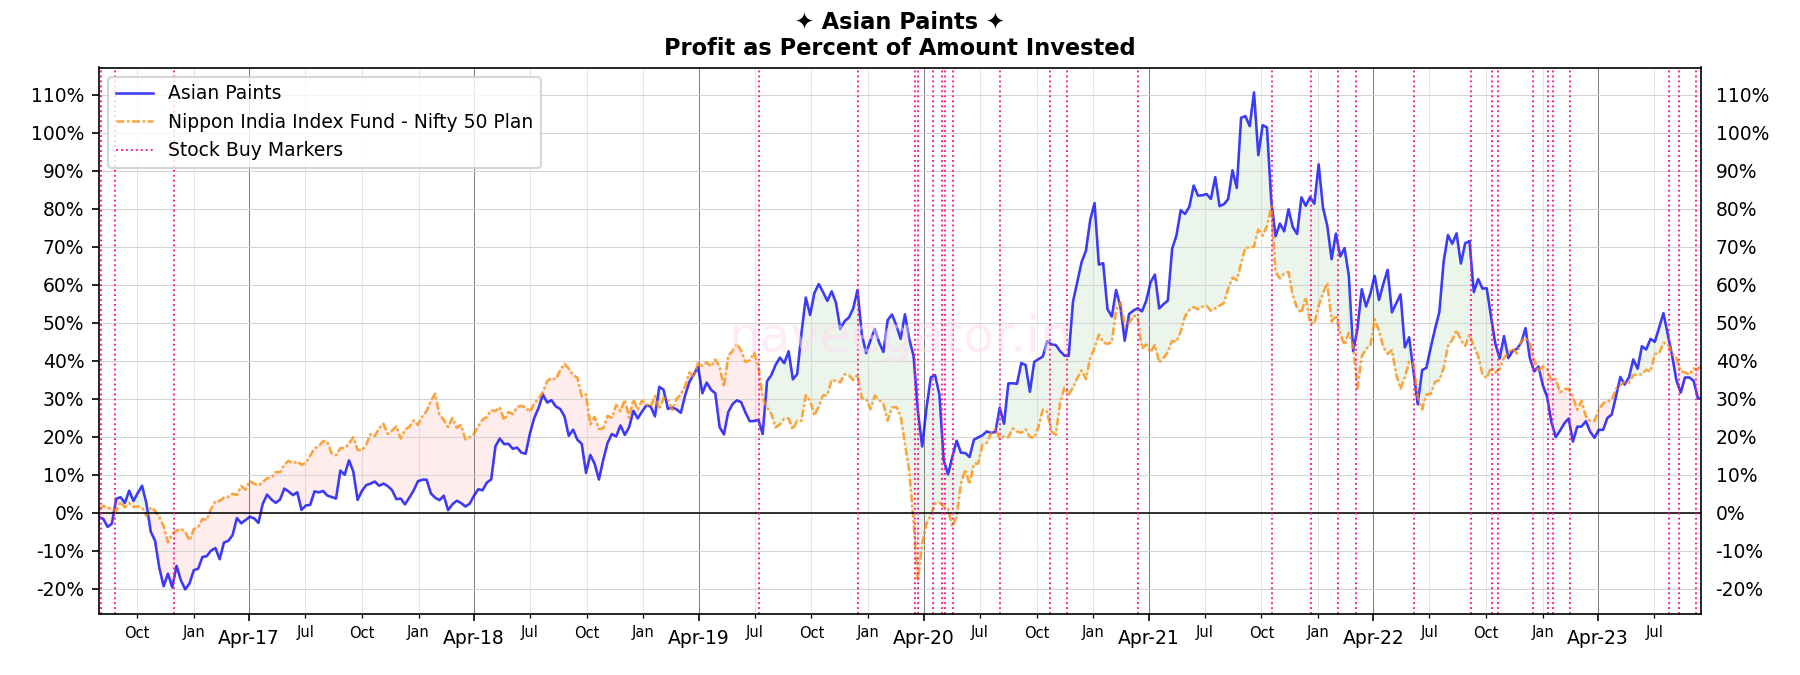
Last one year has been tough on my investment in Asian Paints. After almost 3 years of beating the index—that too consistently—the outperformance has been been replaced with volatility and underperformance. It seems like the Russian invasion of Ukraine and Grasim’s entry into paints business has finally started showing up. At 15% XIRR I am trailing the Nifty 50 Index by 3%.
Note: I missed including some of my Asian Paints share purchases in previous articles. These are rectified in this post, so there will be difference between my previous analysis and this one.

You must be logged in to post a comment.